Using Mezmo and Your Logs to QA and Stage

4 MIN READ
MIN READ

LogDNA is now Mezmo but the product you know and love is here to stay.

An organization’s logging platform is a critical infrastructure component. Its purpose is to provide comprehensive and relevant information about the system, to specific parties, while it's running or when it's being built. For example, developers would require detailed and accurate logs when building and implementing services locally or in remote environments so that they can test new features. On the other hand, QAs and staging environments would find it extremely noisy to maintain all those accumulated logs; they would require more refined logging information that mimics the production stream of events.

In this tutorial, we’ll provide a series of necessary steps to deploy LogDNA agents for QA and staging environments. We will also explain the must-use features and supporting services that allow those teams to discover potential problems early.

Setting Up A Staging Environment

The first thing you need to do is sign up with LogDNA. When this process is finished, you can explore their dashboard page:


On the dashboard page, you have the option to pre-load sample log data, or configure an agent collector yourself (or you can do both). If you select the sample data, you can add applications later. Here is what the screen looks like when the sample data is loaded:


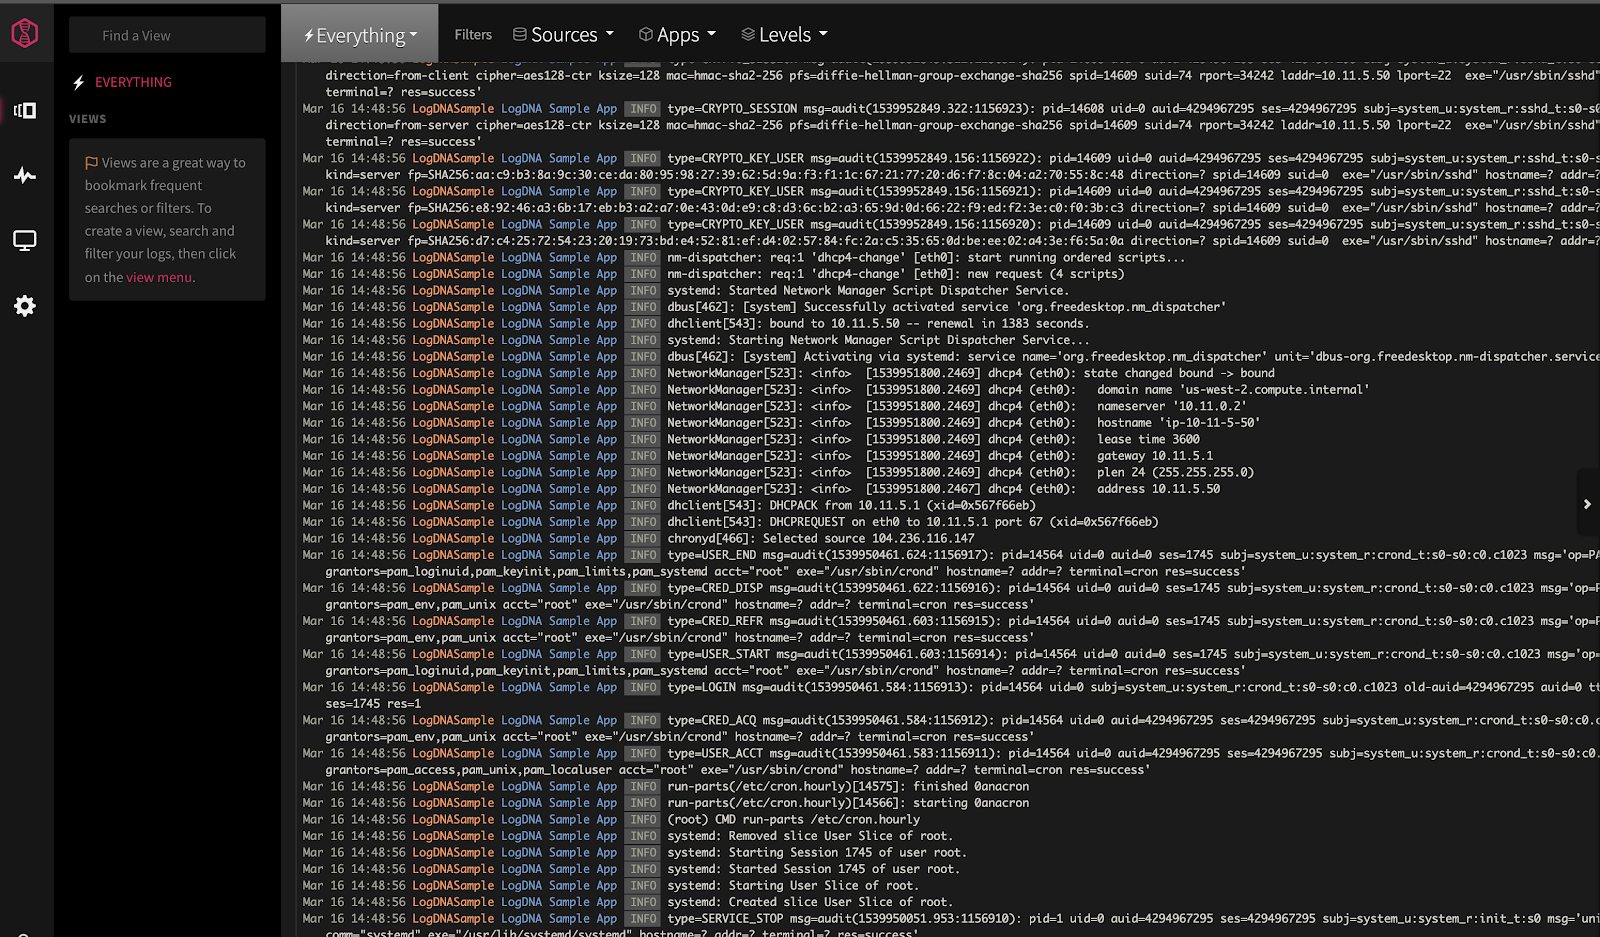
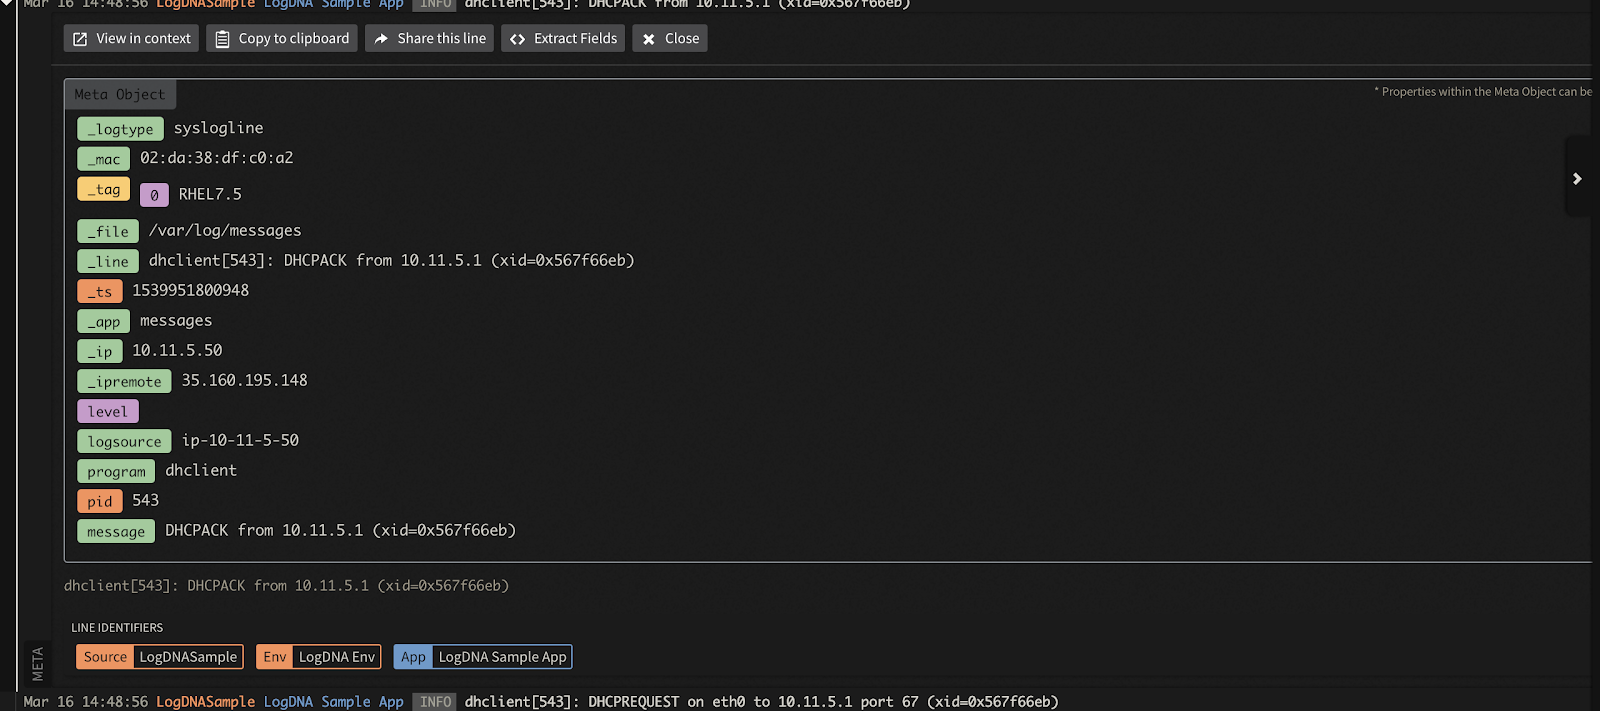
All logs are clearly visible and itemized. When you select a log line, you can view all of the meta field information that was logged at that time:


Next, we’ll show you how to enroll a new application in the platform and run it in production mode so that we can perform tests and log events.

Enrolling a New Application

LogDNA supports ingestion from multiple sources using the LogDNA Agent, Syslog, Code Libraries, and APIs. In this example, we will log data from a Node.js application sourced from this repo.

You can follow the installation process as explained in the ReadME. Then, you will need to hook the LogDNA logger into the Winston.js instance config.

Install the following packages:

$ npm install morgan @types/morgan ip logdna-winston @types/ip --save

Then modify the util/logger.ts file to include the LogDNA configuration:

import winston from "winston"; import logdnaWinston from "logdna-winston"; import ip from "ip"; const logDNAOptions = { key: "LOGDNA_KEY", hostname: "localhost", ip: ip.address(), app: "Typescript-Node", env: "Development", indexMeta: true }; const options: winston.LoggerOptions = { transports: [ new winston.transports.Console({ level: process.env.NODE_ENV === "production" ? "error" : "debug" }), new winston.transports.File({ filename: "debug.log", level: "debug" }) ], }; const logger = winston.createLogger(options); options.handleExceptions = true; logger.add(new logdnaWinston(logDNAOptions)); if (process.env.NODE_ENV !== "production") { logger.debug("Logging initialized at debug level"); } export default logger;

Then add an empty module definition for the logdna-winston package in /src/types/logdna-winston.d.ts declare module 'logdna-winston';

You will need to provide the secret API key for publishing logs in the logDNAOptions. This can be found in the Organization-> API Keys settings:


Once you have everything configured, you will need to start the production environment server.

You want to get as close to a production instance even when connecting to MongoDB or Social Login; for example, using the .env options for, MONGODB_URI, FACEBOOK_ID and FACEBOOK_SECRET. We recommend a production ready MongoDB server from MongoDB Atlas and using a testing account for Facebook Login.

You will have to build the assets first and then start the server. This can be done with the following commands:

$ npm run build && npm run start

You will see the following events logged into the console:

node:47780) Warning: Accessing non-existent property 'MongoError' of module exports inside circular dependency (Use `node --trace-warnings ...` to show where the warning was created) App is running at http://localhost:3000 in production mode

You can navigate into http://localhost:3000/ and interact with the page.

Testing the Environment with LogDNA

If you try to sign up a new account with email, you may encounter an internal server error when navigating to the account page:

Currently the logger does not capture any information about the error. Let’s use the logger to record those error messages so we can inspect them in the LogDNA dashboard.
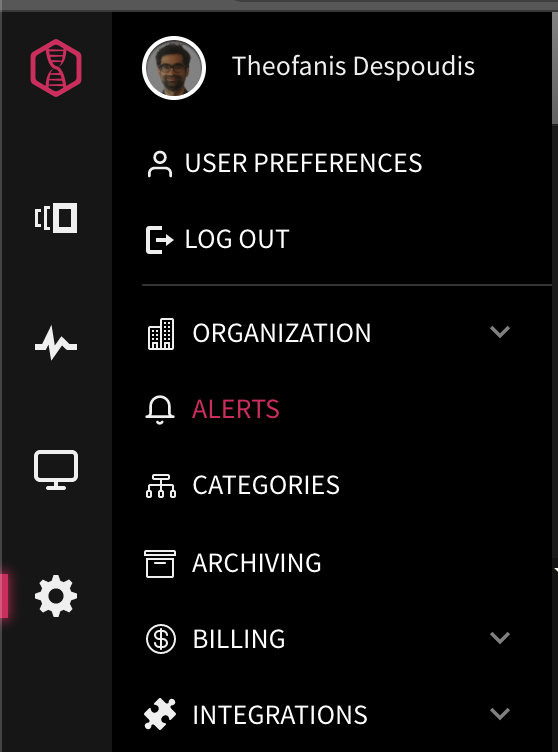
For every render method, you need to add an appropriate handler. For example in src/controllers/home.ts replace the code with:

export const index = (req: Request, res: Response, next: any) => { res.render("home", { title: "Home" }, function(err, html) { if(err !== null) { next(err); } else { res.send(html); } }); };

With errors captured in the template, we need a middleware function to log errors. You can do that by including the following handler in src/server.ts:
app.use((err: any, req: any, res: any, next: any) => { if (err) { logger.log({ level: "error", message: err.message }); } next(err); });

You may also want to capture access logs. You can add a morgan logger middleware in src/app.ts:

// eslint-disable-next-line // @ts-ignore app.use(morgan("combined", { stream: { write: (message: string): void => { logger.info(message.trim()); } } }));

Now you can inspect the logs in the dashboard:


Alerts

You can set up alerts so that certain log lines trigger notifications. This is done in the alerts sidebar option:


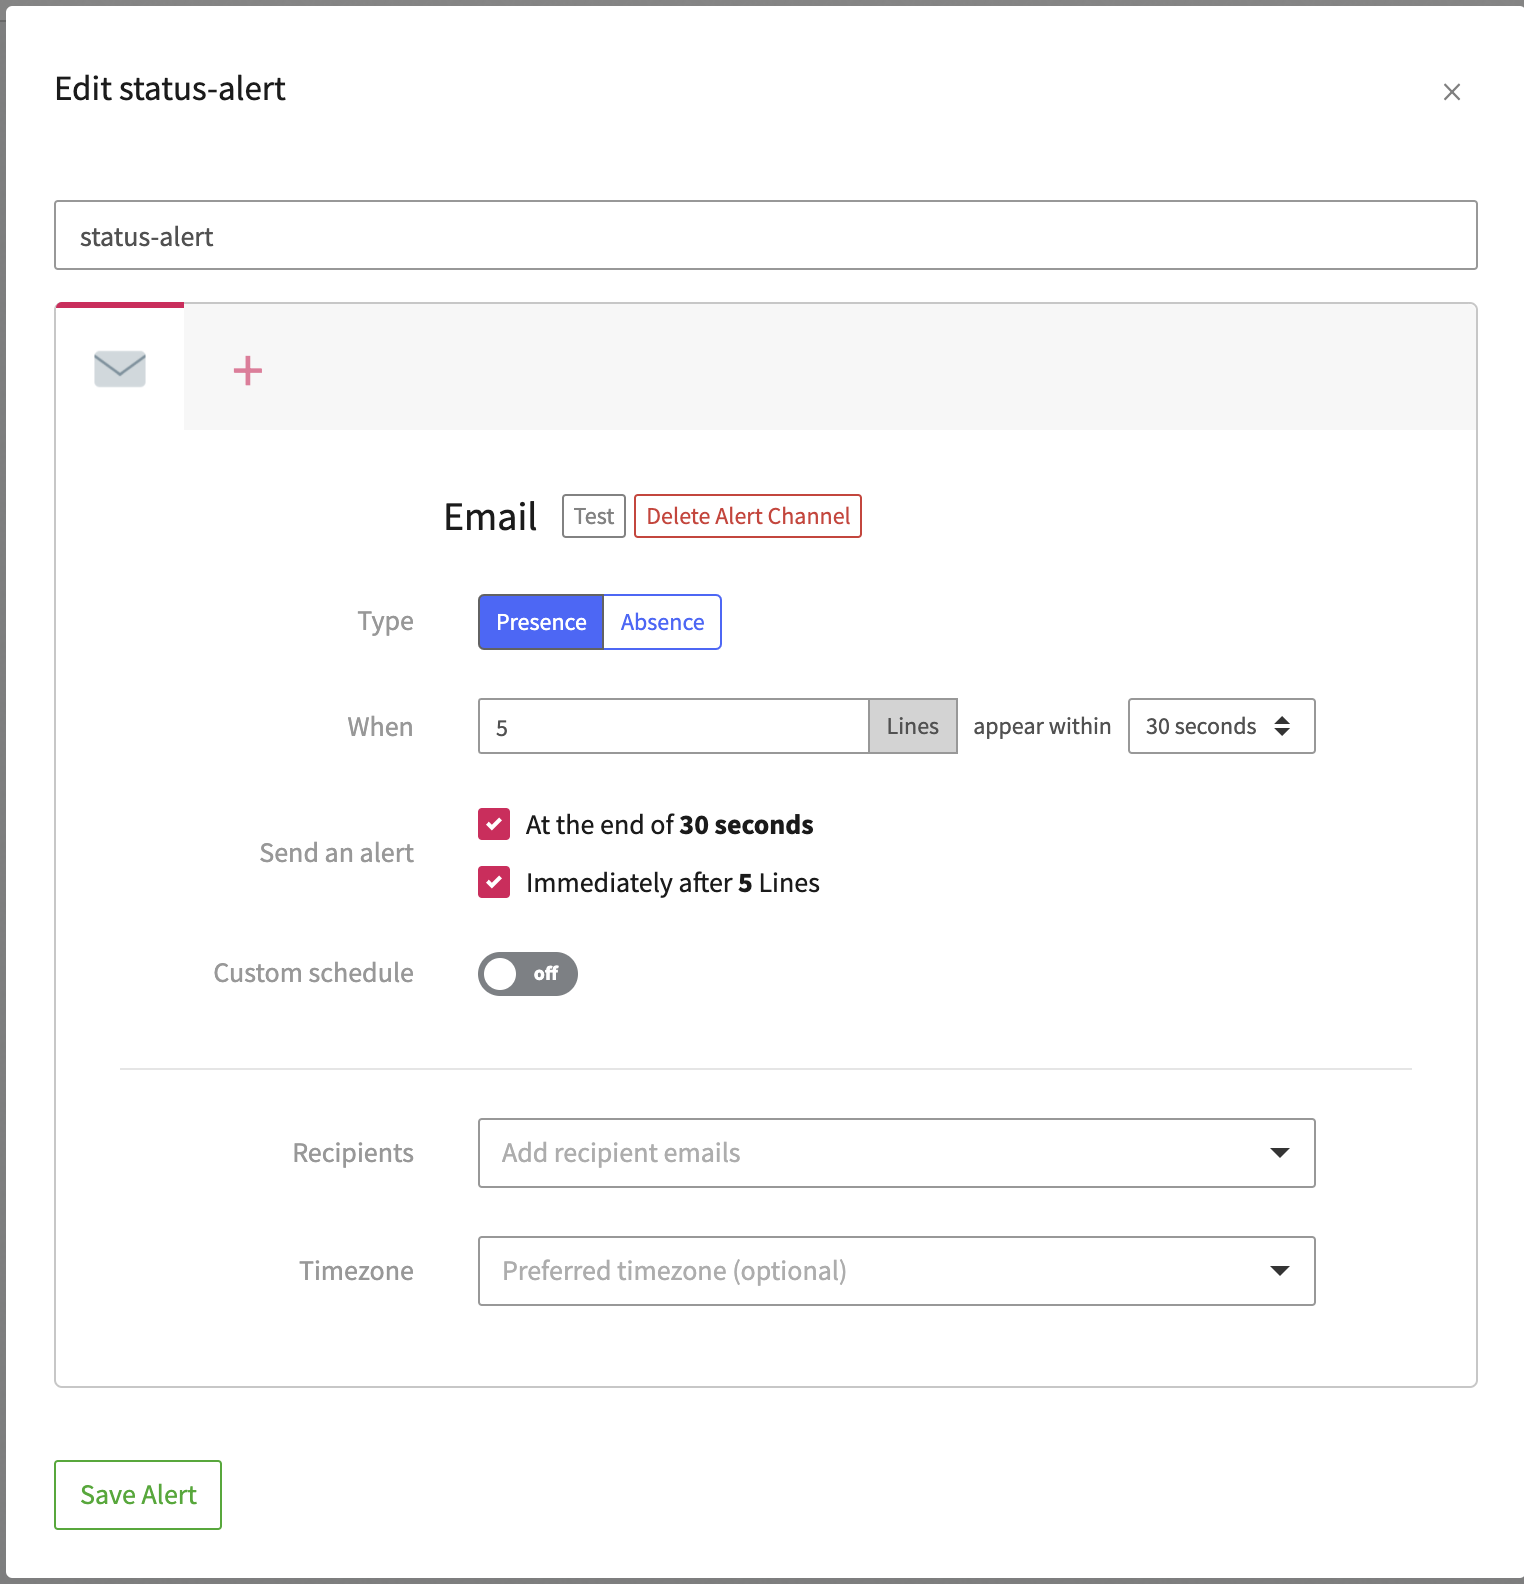
Let’s first create an alert that triggers an email after at least 5 events are logged. When you click ‘Add Preset’ you will need to fill in those details:


Once created, you want to attach a View into it. A View is a saved filtering of logs based on some criteria like status codes for 400, 500, or other errors. In this example, we create a View for the template errors we found earlier.

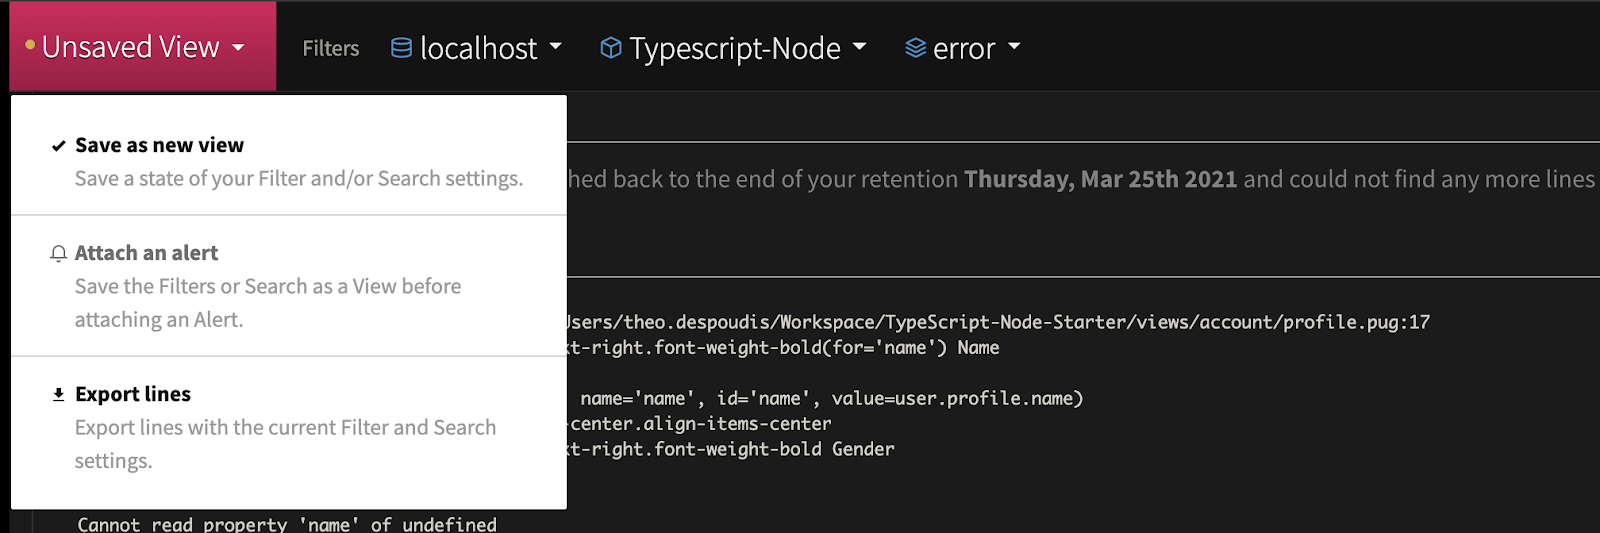
On the Logs view, you want to select the appropriate filters on the top bar. Select host=localhost, Application=Typescript-Node and level=Error and click on the Unsaved View -> Save as a new view and select the Alert we created before.


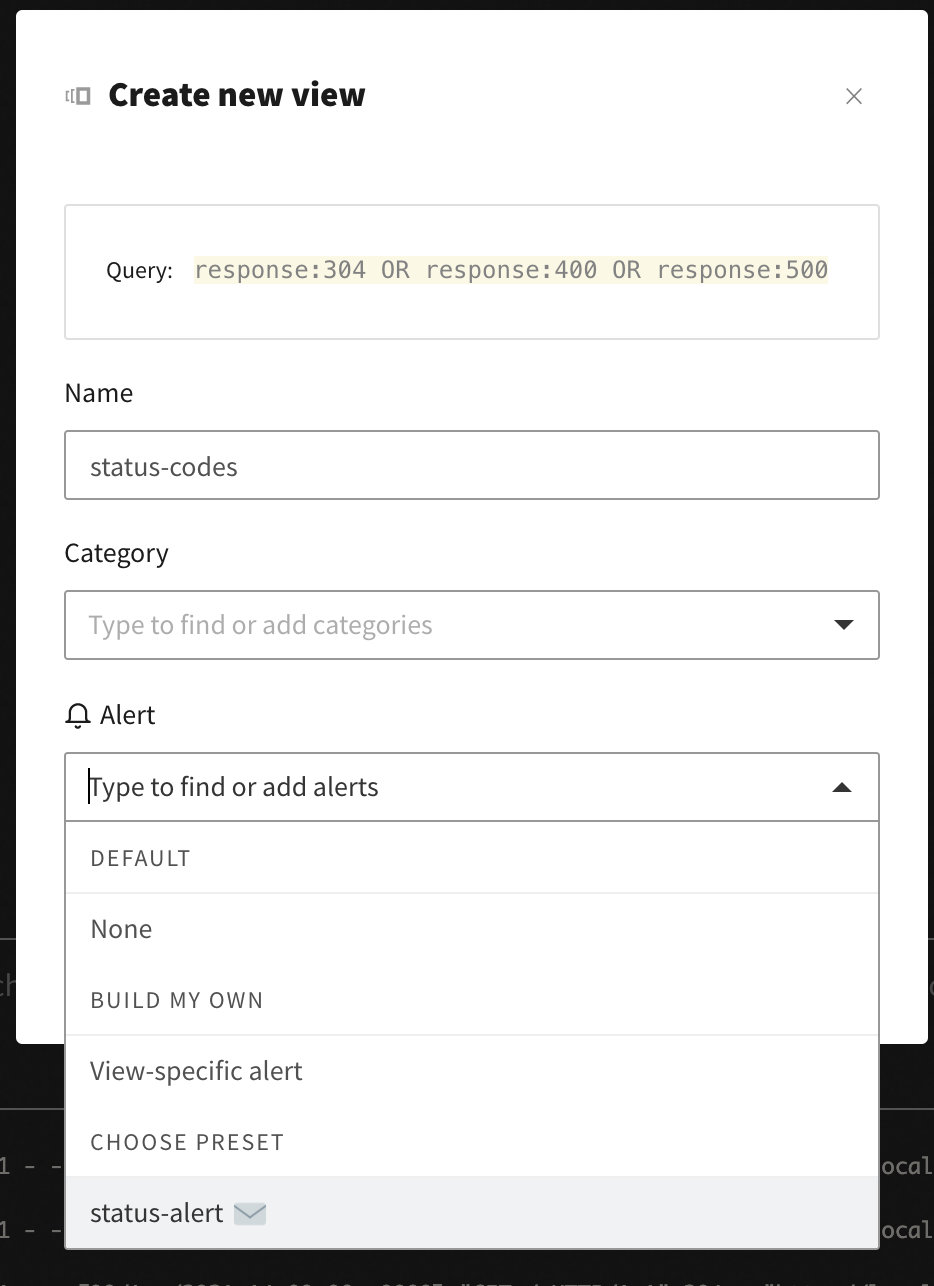
Let’s add another one for specific status codes like 304, 400, and 500. You may want to use the query language at the bottom search bar. Enter the following query and save it as new View:

response:304 OR response:400 OR response:500

The view modal shows the parameters you selected and which alert to use:


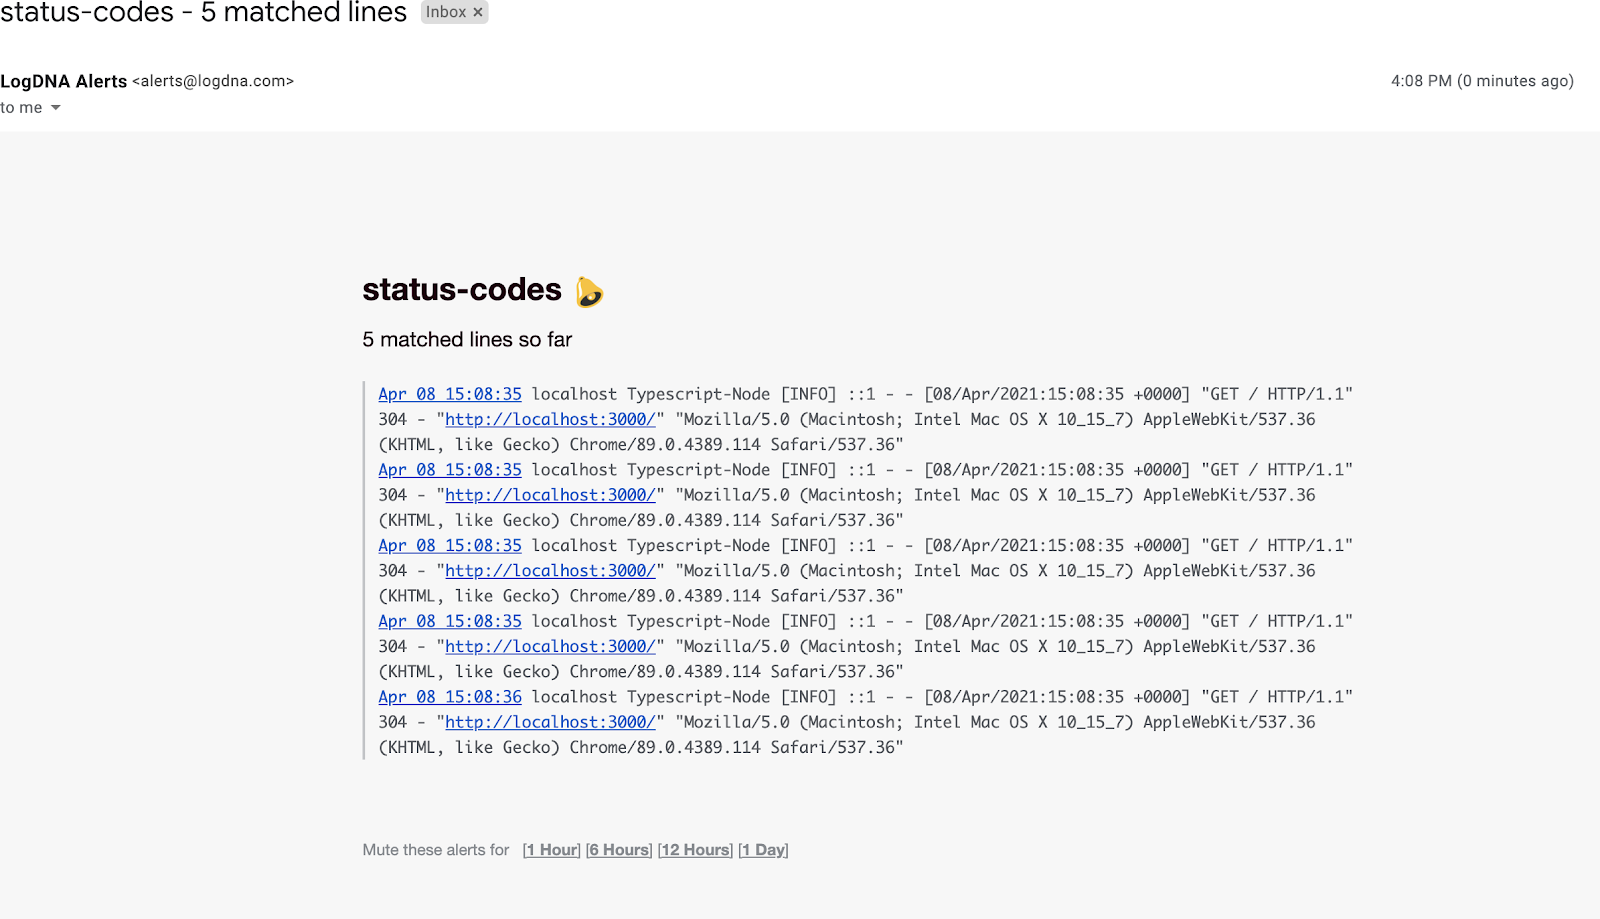
Now you will get email notifications when you exceed those alert thresholds:


Sharing Views with Developers

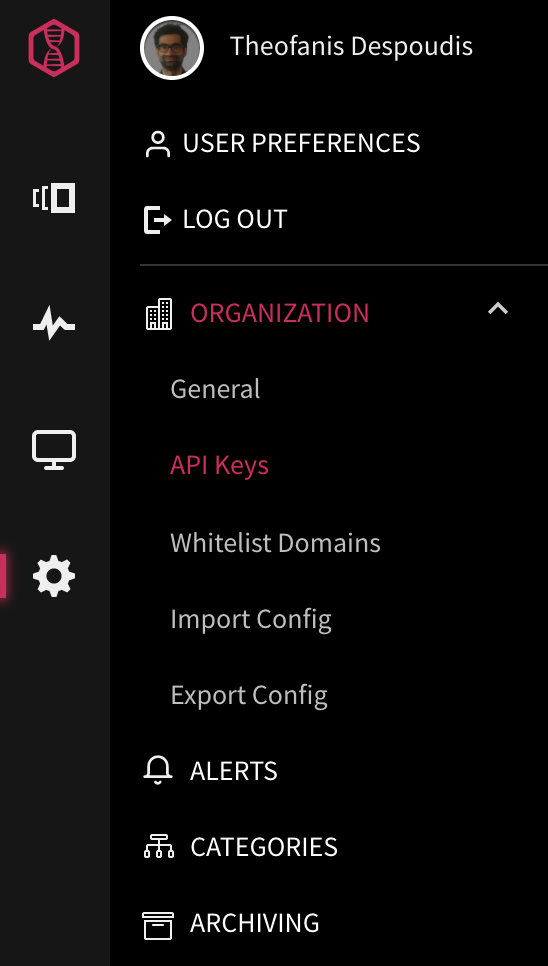
With some views available you can now share them with developers or related parties so they can inspect them on their own. You can use the Export Lines option to grab an export when selecting an existing View from the top Bar:


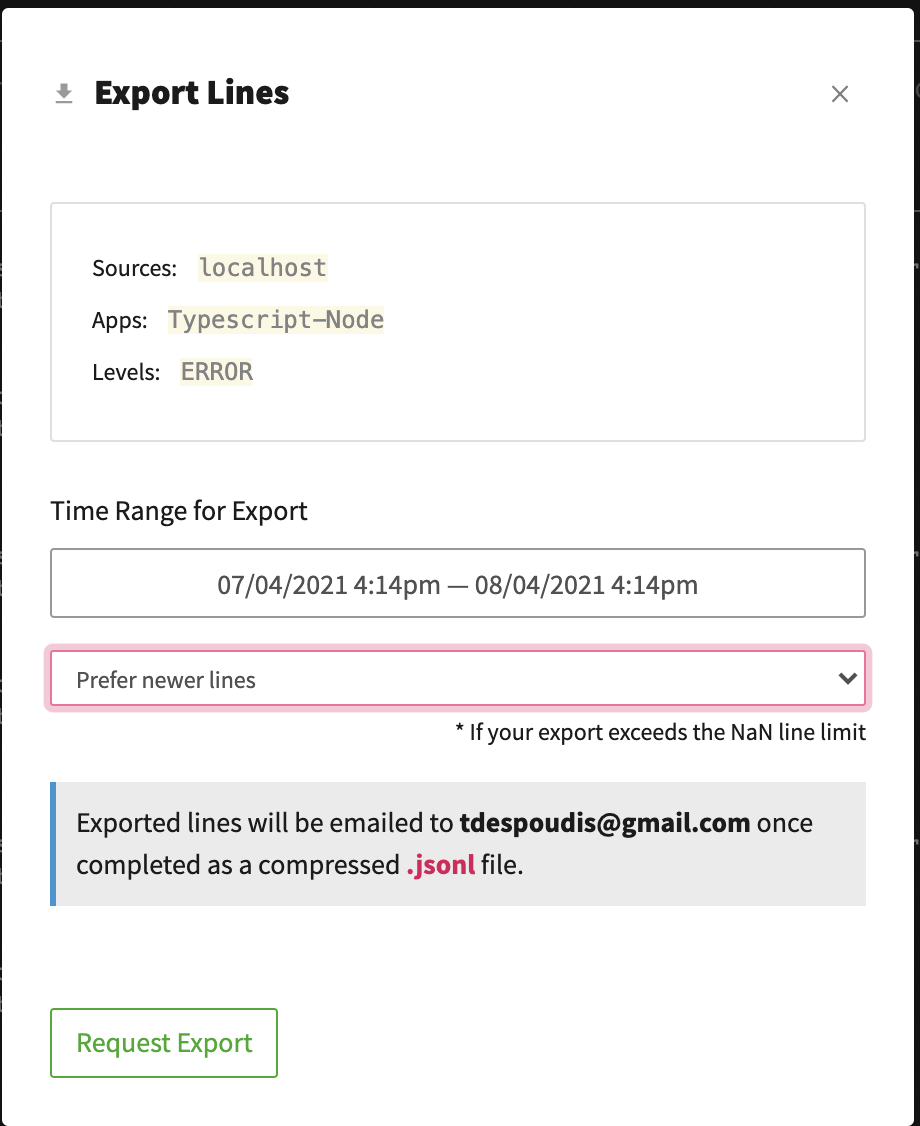
You will get an email containing the lines in jsonl (JSON Lines) format. Send those files to the developers; they can inspect them with the following command:

❯ cat export_2021-04-08-15-16-00-827_544dfc58-785c-4a1f-9151-8b480dd038ef.jsonl | jq .

If the developers have access to the Dashboard, you can share the link to the view as well. This is an example link:

https://app.logdna.com/b5a09b29ad/logs/view/d02237cb23

How to Exclude Log Lines Before and After Ingestion

When logging information in requests – especially for environments that mimic the production site – it’s significant not to capture any sensitive data such as login credentials or passwords. You can define rules, using regex (regular expressions), to control what log data is collected by the agent and forwarded to LogDNA to prevent those kinds of events from ever appearing in the LogDNA dashboard (check out this GitHub repo to learn how).

You may also want to filter out logs by sources, by app, or by specific queries using an Exclusion Rule. These are great for excluding debug lines, analytics logs, and excessive noise from logs that aren’t useful. You can still see these logs in Live Tail and be alerted on them if needed but they won’t be stored. To start, find the Usage-Exclusion Rules option in the sidebar:


Then you will need to fill in some information about the rule. You may want to find specific log lines that match the query first. Here is an example with a message matching the following lines:

meta.message:'password=' OR meta.message:'email='

This tells us to ignore lines with messages containing the strings password= or email=. Note that this will not capture those lines; so if you want to capture the information but not the sensitive data, you will need to redact it from the application.


Examining automated tests for failures

You are not limited to using the logger instance for runtime information capture. You can use it for CI/CD pipelines and test cases as well. This would give you a convenient way to capture test results all within the LogDNA dashboard. 

Because you may want to capture specific information during a CI/CD pipeline, you want to attach a meta tag or a different level on it. At first, when you run test under CI/CD, you want to set a CI=true environment variable and pass it into the logger instance config:

Because you may want to capture specific information during a CI/CD pipeline, you want to attach a meta tag or a different level on it. At first, when you run test under CI/CD, you want to set a CI=true environment variable and pass it into the logger instance config:

const isCI = process.env.CI === "true"; const logDNAOptions = { key: "b5a09b29ad1d386964c61346108fc981", hostname: "localhost", ip: ip.address(), app: "Typescript-Node", env: isCI ? "testing" : "production", indexMeta: true };

Then you may want to create a new View with that Environment. In order to capture errors you may want to configure a custom reporter to log any failed test cases. This is beyond the scope of this tutorial, but you can see an example using Jest here:

https://jestjs.io/docs/configuration#reporters-arraymodulename--modulename-options

Once you get those logs captured, you can connect them with Alerts and Boards as well. This will help you visualize these errors and correlate them with recent code changes.

Conclusion and Next Steps

In this article, we saw how to leverage the LogDNA platform for QA and staging environments. As a rule of thumb, those environments should match exactly the production versions in both functional and non-functional requirements. Additionally, when running integration and system tests, those test logs should be queryable in case of failures. Using LogDNA Alerts, Boards, Graphs and Screens can help catch and visualize those errors in correlation to any recent code changes. Lastly, using saved Views, you can delegate important information to developers when trying to discover significant problems or performance bottlenecks. Feel free to trial the LogDNA platform at your own pace.


Table of Contents

    Share Article

    RSS Feed

    Next blog post
    You're viewing our latest blog post.
    Previous blog post
    You're viewing our oldest blog post.
    Mezmo + Catchpoint deliver observability SREs can rely on
    Mezmo’s AI-powered Site Reliability Engineering (SRE) agent for Root Cause Analysis (RCA)
    What is Active Telemetry
    Launching an agentic SRE for root cause analysis
    Paving the way for a new era: Mezmo's Active Telemetry
    The Answer to SRE Agent Failures: Context Engineering
    Empowering an MCP server with a telemetry pipeline
    The Debugging Bottleneck: A Manual Log-Sifting Expedition
    The Smartest Member of Your Developer Ecosystem: Introducing the Mezmo MCP Server
    Your New AI Assistant for a Smarter Workflow
    The Observability Problem Isn't Data Volume Anymore—It's Context
    Beyond the Pipeline: Data Isn't Oil, It's Power.
    The Platform Engineer's Playbook: Mastering OpenTelemetry & Compliance with Mezmo and Dynatrace
    From Alert to Answer in Seconds: Accelerating Incident Response in Dynatrace
    Taming Your Dynatrace Bill: How to Cut Observability Costs, Not Visibility
    Architecting for Value: A Playbook for Sustainable Observability
    How to Cut Observability Costs with Synthetic Monitoring and Responsive Pipelines
    Unlock Deeper Insights: Introducing GitLab Event Integration with Mezmo
    Introducing the New Mezmo Product Homepage
    The Inconvenient Truth About AI Ethics in Observability
    Observability's Moneyball Moment: How AI Is Changing the Game (Not Ending It)
    Do you Grok It?
    Top Five Reasons Telemetry Pipelines Should Be on Every Engineer’s Radar
    Is It a Cup or a Pot? Helping You Pinpoint the Problem—and Sleep Through the Night
    Smarter Telemetry Pipelines: The Key to Cutting Datadog Costs and Observability Chaos
    Why Datadog Falls Short for Log Management and What to Do Instead
    Telemetry for Modern Apps: Reducing MTTR with Smarter Signals
    Transforming Observability: Simpler, Smarter, and More Affordable Data Control
    Datadog: The Good, The Bad, The Costly
    Mezmo Recognized with 25 G2 Awards for Spring 2025
    Reducing Telemetry Toil with Rapid Pipelining
    Cut Costs, Not Insights:   A Practical Guide to Telemetry Data Optimization
    Webinar Recap: Telemetry Pipeline 101
    Petabyte Scale, Gigabyte Costs: Mezmo’s Evolution from ElasticSearch to Quickwit
    2024 Recap - Highlights of Mezmo’s product enhancements
    My Favorite Observability and DevOps Articles of 2024
    AWS re:Invent ‘24: Generative AI Observability, Platform Engineering, and 99.9995% Availability
    From Gartner IOCS 2024 Conference: AI, Observability Data, and Telemetry Pipelines
    Our team’s learnings from Kubecon: Use Exemplars, Configuring OTel, and OTTL cookbook
    How Mezmo Uses a Telemetry Pipeline to Handle Metrics, Part II
    Webinar Recap: 2024 DORA Report: Accelerate State of DevOps
    Kubecon ‘24 recap: Patent Trolls, OTel Lessons at Scale, and Principle Platform Abstractions
    Announcing Mezmo Flow: Build a Telemetry Pipeline in 15 minutes
    Key Takeaways from the 2024 DORA Report
    Webinar Recap | Telemetry Data Management: Tales from the Trenches
    What are SLOs/SLIs/SLAs?
    Webinar Recap | Next Gen Log Management: Maximize Log Value with Telemetry Pipelines
    Creating In-Stream Alerts for Telemetry Data
    Creating Re-Usable Components for Telemetry Pipelines
    Optimizing Data for Service Management Objective Monitoring
    More Value From Your Logs: Next Generation Log Management from Mezmo
    A Day in the Life of a Mezmo SRE
    Webinar Recap: Applying a Data Engineering Approach to Telemetry Data
    Dogfooding at Mezmo: How we used telemetry pipeline to reduce data volume
    Unlocking Business Insights with Telemetry Pipelines
    Why Your Telemetry (Observability) Pipelines Need to be Responsive
    How Data Profiling Can Reduce Burnout
    Data Optimization Technique: Route Data to Specialized Processing Chains
    Data Privacy Takeaways from Gartner Security & Risk Summit
    Mastering Telemetry Pipelines: Driving Compliance and Data Optimization
    A Recap of Gartner Security and Risk Summit: GenAI, Augmented Cybersecurity, Burnout
    Why Telemetry Pipelines Should Be A Part Of Your Compliance Strategy
    Pipeline Module: Event to Metric
    Telemetry Data Compliance Module
    OpenTelemetry: The Key To Unified Telemetry Data
    Data optimization technique: convert events to metrics
    What’s New With Mezmo: In-stream Alerting
    How Mezmo Used Telemetry Pipeline to Handle Metrics
    Webinar Recap: Mastering Telemetry Pipelines - A DevOps Lifecycle Approach to Data Management
    Open-source Telemetry Pipelines: An Overview
    SRECon Recap: Product Reliability, Burn Out, and more
    Webinar Recap: How to Manage Telemetry Data with Confidence
    Webinar Recap: Myths and Realities in Telemetry Data Handling
    Using Vector to Build a Telemetry Pipeline Solution
    Managing Telemetry Data Overflow in Kubernetes with Resource Quotas and Limits
    How To Optimize Telemetry Pipelines For Better Observability and Security
    Gartner IOCS Conference Recap: Monitoring and Observing Environments with Telemetry Pipelines
    AWS re:Invent 2023 highlights: Observability at Stripe, Capital One, and McDonald’s
    Webinar Recap: Best Practices for Observability Pipelines
    Introducing Responsive Pipelines from Mezmo
    My First KubeCon - Tales of the K8’s community, DE&I, sustainability, and OTel
    Modernize Telemetry Pipeline Management with Mezmo Pipeline as Code
    How To Profile and Optimize Telemetry Data: A Deep Dive
    Kubernetes Telemetry Data Optimization in Five Steps with Mezmo
    Introducing Mezmo Edge: A Secure Approach To Telemetry Data
    Understand Kubernetes Telemetry Data Immediately With Mezmo’s Welcome Pipeline
    Unearthing Gold: Deriving Metrics from Logs with Mezmo Telemetry Pipeline
    Webinar Recap: The Single Pane of Glass Myth
    Empower Observability Engineers: Enhance Engineering With Mezmo
    Webinar Recap: How to Get More Out of Your Log Data
    Unraveling the Log Data Explosion: New Market Research Shows Trends and Challenges
    Webinar Recap: Unlocking the Full Value of Telemetry Data
    Data-Driven Decision Making: Leveraging Metrics and Logs-to-Metrics Processors
    How To Configure The Mezmo Telemetry Pipeline
    Supercharge Elasticsearch Observability With Telemetry Pipelines
    Enhancing Grafana Observability With Telemetry Pipelines
    Optimizing Your Splunk Experience with Telemetry Pipelines
    Webinar Recap: Unlocking Business Performance with Telemetry Data
    Enhancing Datadog Observability with Telemetry Pipelines
    Transforming Your Data With Telemetry Pipelines