You’ve built something amazing. Your services are scaling, your users are happy, and your team is shipping code like never before. Then the cloud bill arrives, and one line item makes your eyes water: observability. That Datadog invoice feels less like a utility bill and more like a ransom note.
It’s a modern engineering paradox. The tools that give you sight into your complex systems are the same ones that can blind you with runaway costs. You’re told this is just the price of doing business at scale.
The common response to this problem is a periodic cleanup. An SRE or Platform team will audit telemetry data, trim the excess, and bring costs back in line. But this approach only treats the symptom. Inevitably, a developer makes a change to gain new visibility, triggering another uncontrolled surge in data. The cycle repeats, trapping SREs in a constant state of firefighting. The only way to break this loop is to stop fixing it after the fact. The solution is a durable governance structure that empowers your teams to manage these cost drivers over time, preventing bill shock before it ever happens.
But what if it’s not? What if that spiraling bill isn't an inevitability, but the result of a system that’s working as designed—for your vendor?
It’s time for a different approach. Let's break down the four quiet culprits inflating your bill and how you can start making better choices today.
Cost Driver #1: The Custom Metric Tax
You know the one. That brilliant custom metric you created to track user activity, tagged with customer_id. It was insightful, elegant, and single-handedly doubled your bill. This is the #1 driver of observability costs, and it’s a killer. Every unique tag combination creates a new time series, and platforms like Datadog are more than happy to charge you for every single one. You're paying a premium for data that is often redundant.
The Fix: Stop Paying for Raw Noise, Invest in Refined Signal
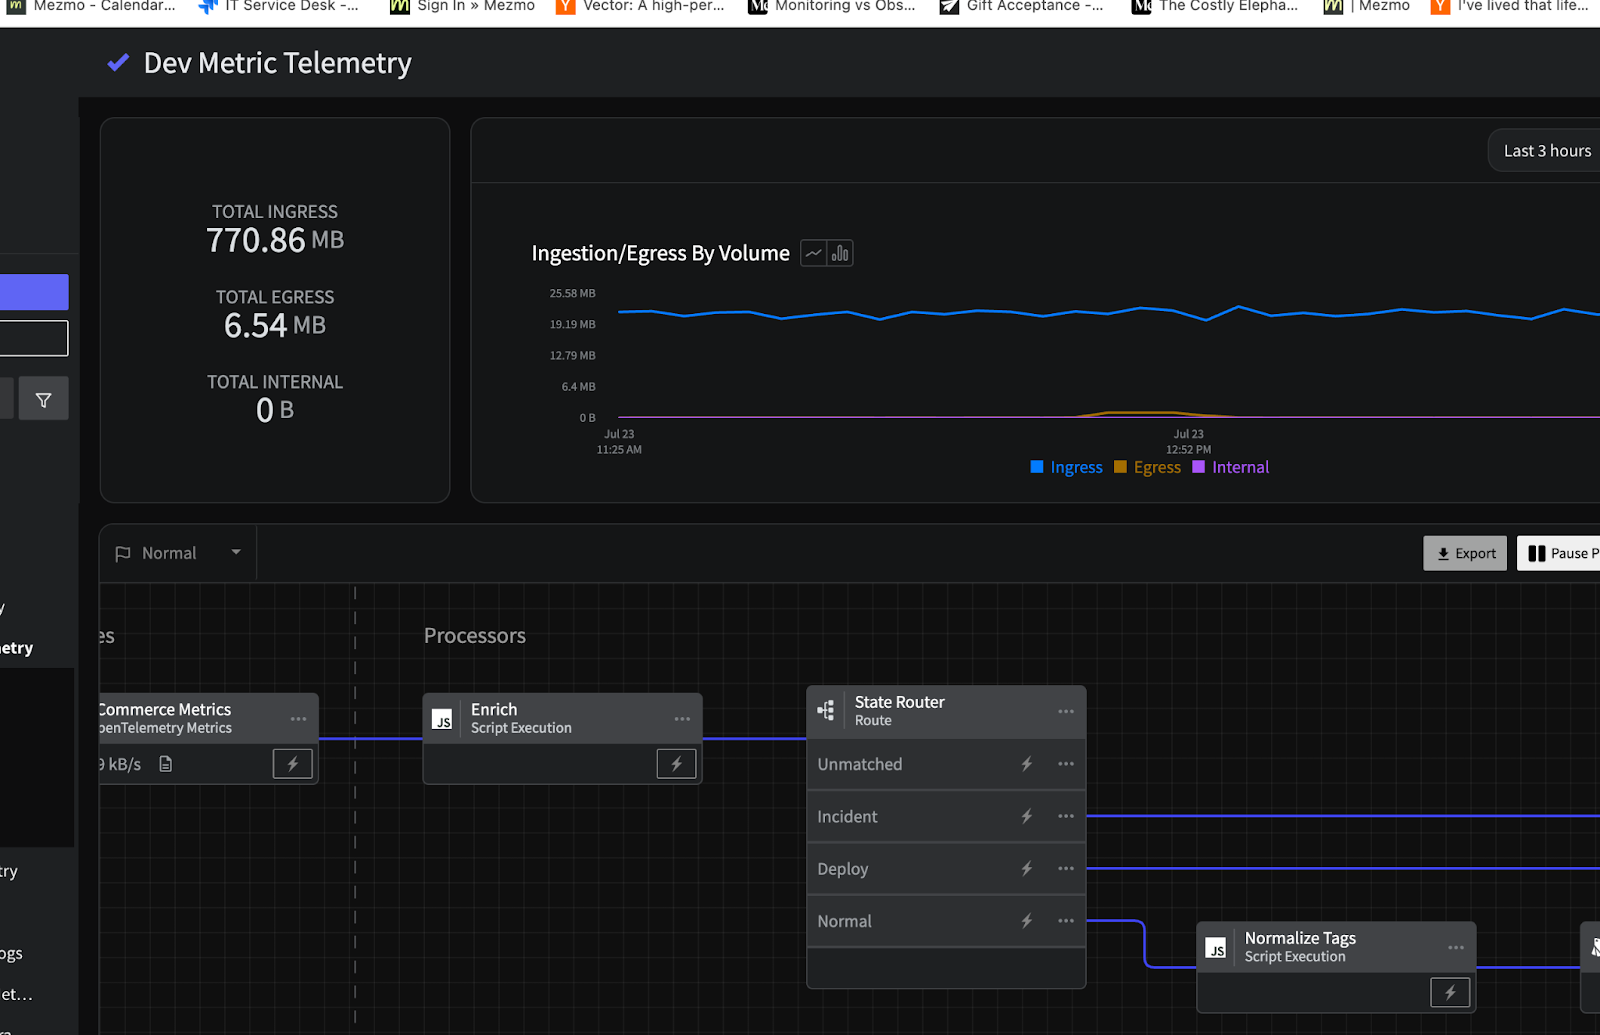
Instead of shipping every raw metric and hoping for the best, you need to shape your data before it hits your vendor. This is where Mezmo’s Metric Aggregation & Shaping comes in. Think of it as a refinery for your telemetry. It transforms that high-volume, low-signal firehose of raw metrics into low-cost, high-signal aggregates, all in-stream without any data loss. With Mezmo’s Responsive Pipelines, send exactly what’s needed only when it's needed, whether its generating new metrics in stream to resolve incidents or switching to higher fidelity metrics to aid in incident response.
You get the crucial insights—the P95s, the averages, the counts—without paying for the noise. It’s the single best solution to the single biggest cost driver.
Cost Driver #2: The Cardinality Curse
Cardinality is one of those technical terms that sounds innocent until it costs you a fortune. It’s the number of unique values for a given tag, and it’s a silent bill killer. That session_id, request_id, or specific URL you’re tagging creates a combinatorial explosion of costs. You’re not just paying for a metric; you’re paying for every possible permutation of its existence. It’s death by a thousand tiny, unique cuts.
The Fix: Don't Let Your Tags Run Your Wallet
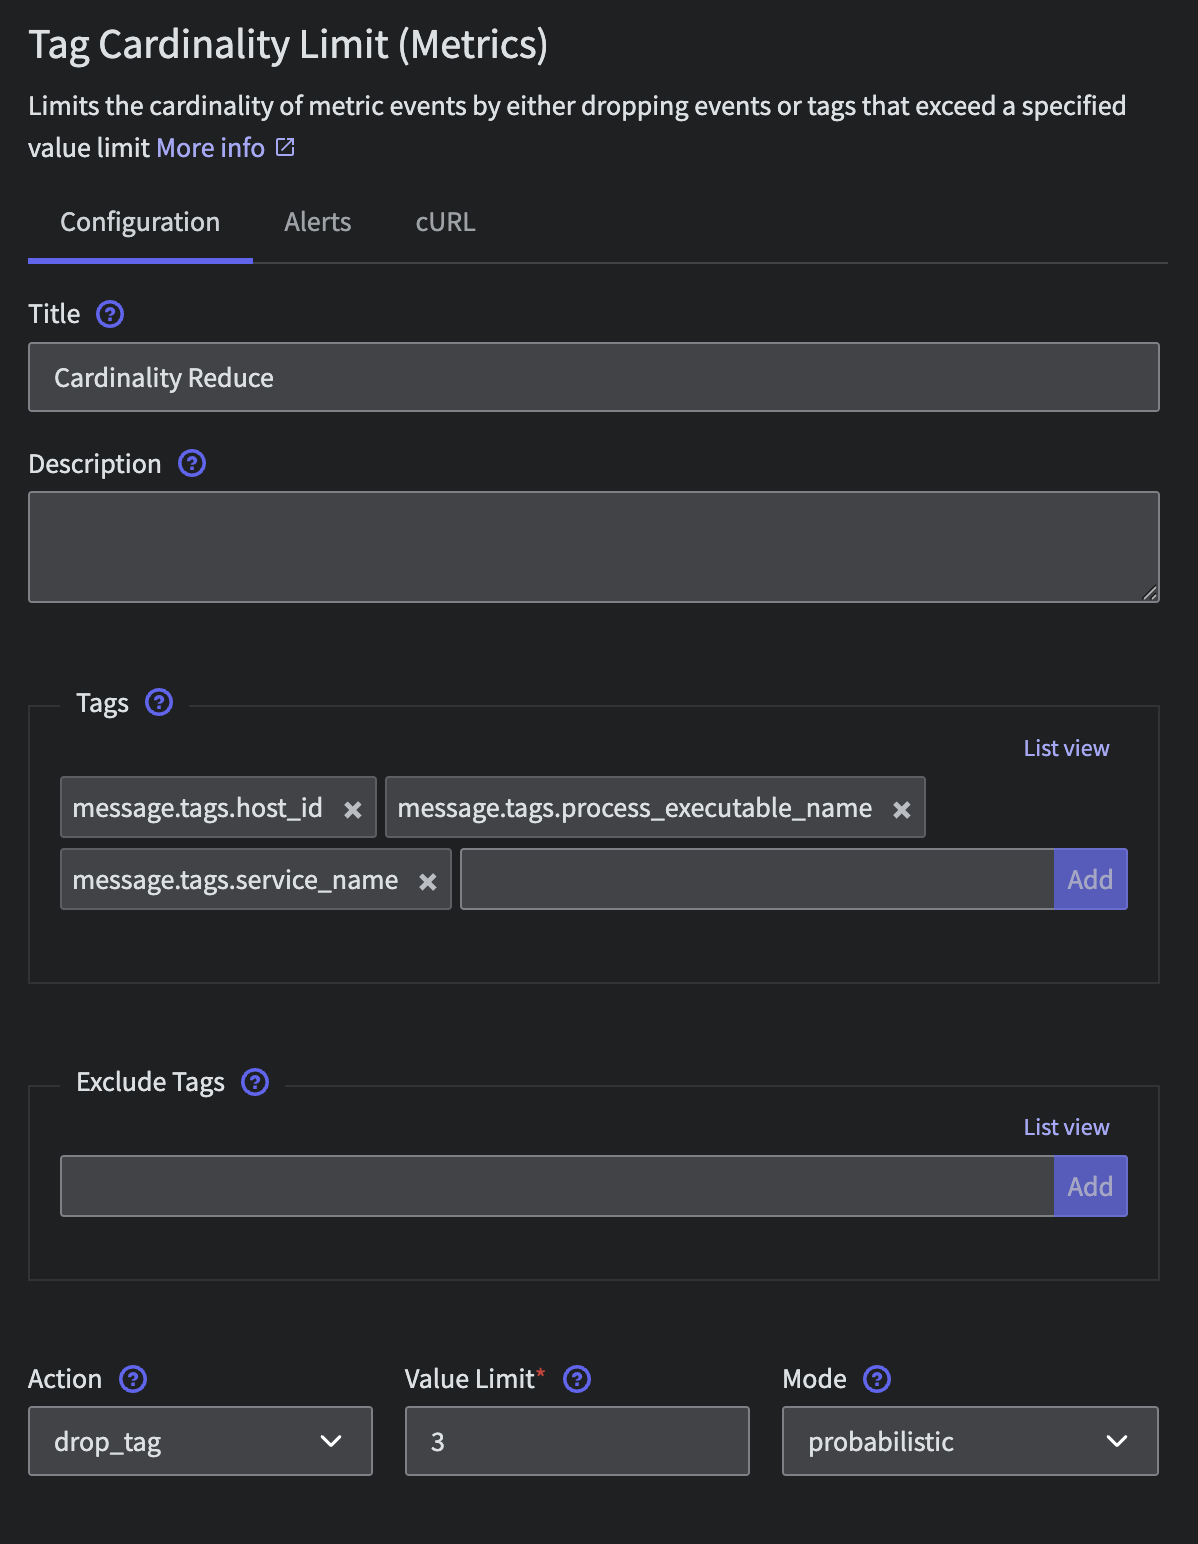
The answer isn't to stop using tags; it's to control them. With Mezmo’s Cardinality Management, you can stop reacting to these explosions and start preventing them. Run regular in-stream checks on cardinality with Field Summaries and then take informed steps to drop unnecessary tags that explode metric cardinality. It’s like having a bouncer for your data pipeline. You can explicitly filter, remap, or even hash metric dimensions on the fly. That request_id can be scrubbed, and those user-specific URLs can be grouped into /api/user/*. It gives you explicit, granular control to prevent the combinatorial chaos before it ever has a chance to hit your invoice.
Cost Driver #3: The Deluge of "Just-in-Case" Logs
Logs are your best friend during an outage and a financial black hole the rest of the time. In the heat of an incident, you want every scrap of information you can get. So, we default to logging everything, especially those verbose DEBUG logs, "just in case." This floods your ingestion pipeline and your budget, and ironically, when you need them most, you’re stuck waiting for them to be indexed.
The Fix: See It Live, Pay for What Matters
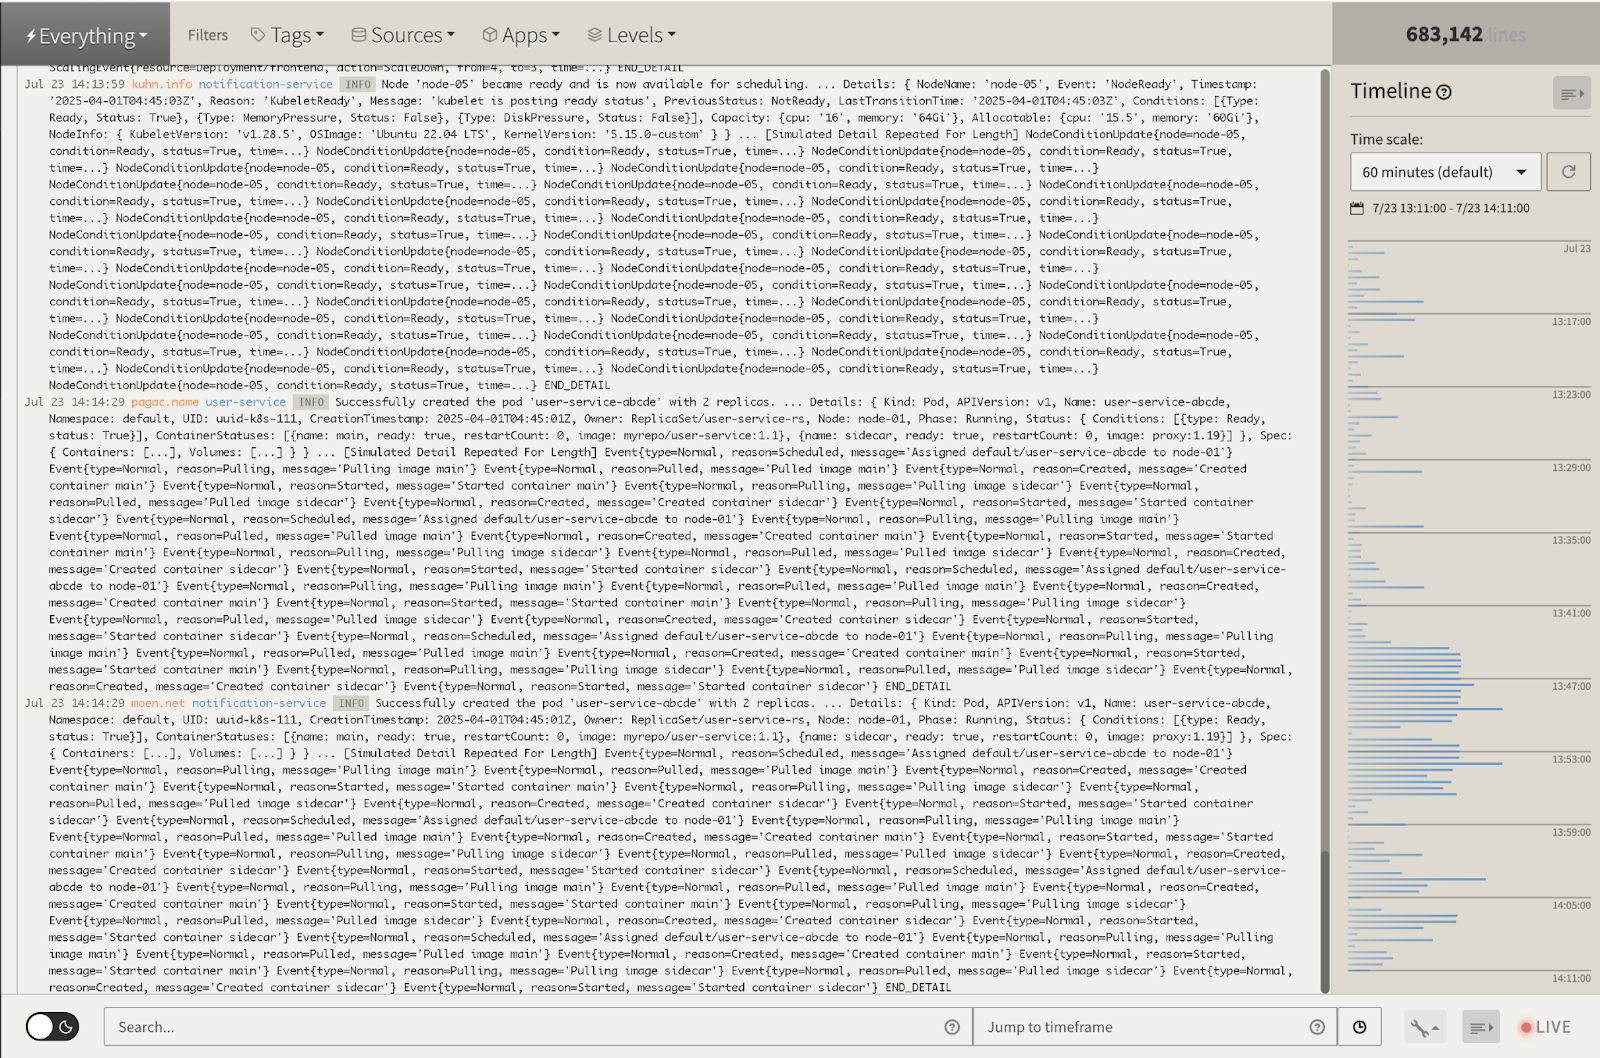
What if you could have the best of both worlds? The ability to see everything during an incident, without paying to store it all forever? That’s Mezmo's Live Tail. It gives you a real-time stream of your raw logs and events regardless of chosen retention. You can see exactly what’s happening, as it’s happening, and troubleshoot an incident before your data even hits a paid platform. Whether it's a pre-production environment or logs you only need to monitor on deployment, Live Tail completely bypasses ingestion delays and costs, allowing you to treat logging as a real-time diagnostic tool, not just an expensive historical archive.
Cost Driver #4: The APM Blank Check
APM is magical for untangling the spaghetti of microservices. But the temptation of "trace everything" for complete visibility is the equivalent of writing your vendor a blank check. The industry’s answer, head-based sampling, is a flawed gamble because it decides whether to keep a trace at the very beginning of a request, long before knowing if it will end in a critical error or a massive latency spike. This creates a painful financial trap where you pay a premium to store low-value "happy path" traces while the one trace that could solve an incident is likely dropped. Even for the error traces you do capture, their high volume makes finding the root cause a costly and frustrating exercise in sifting through noise, leaving you to pay for data you don't need while struggling to find the insights you do.
The Fix: Stop Guessing, Start Guaranteeing
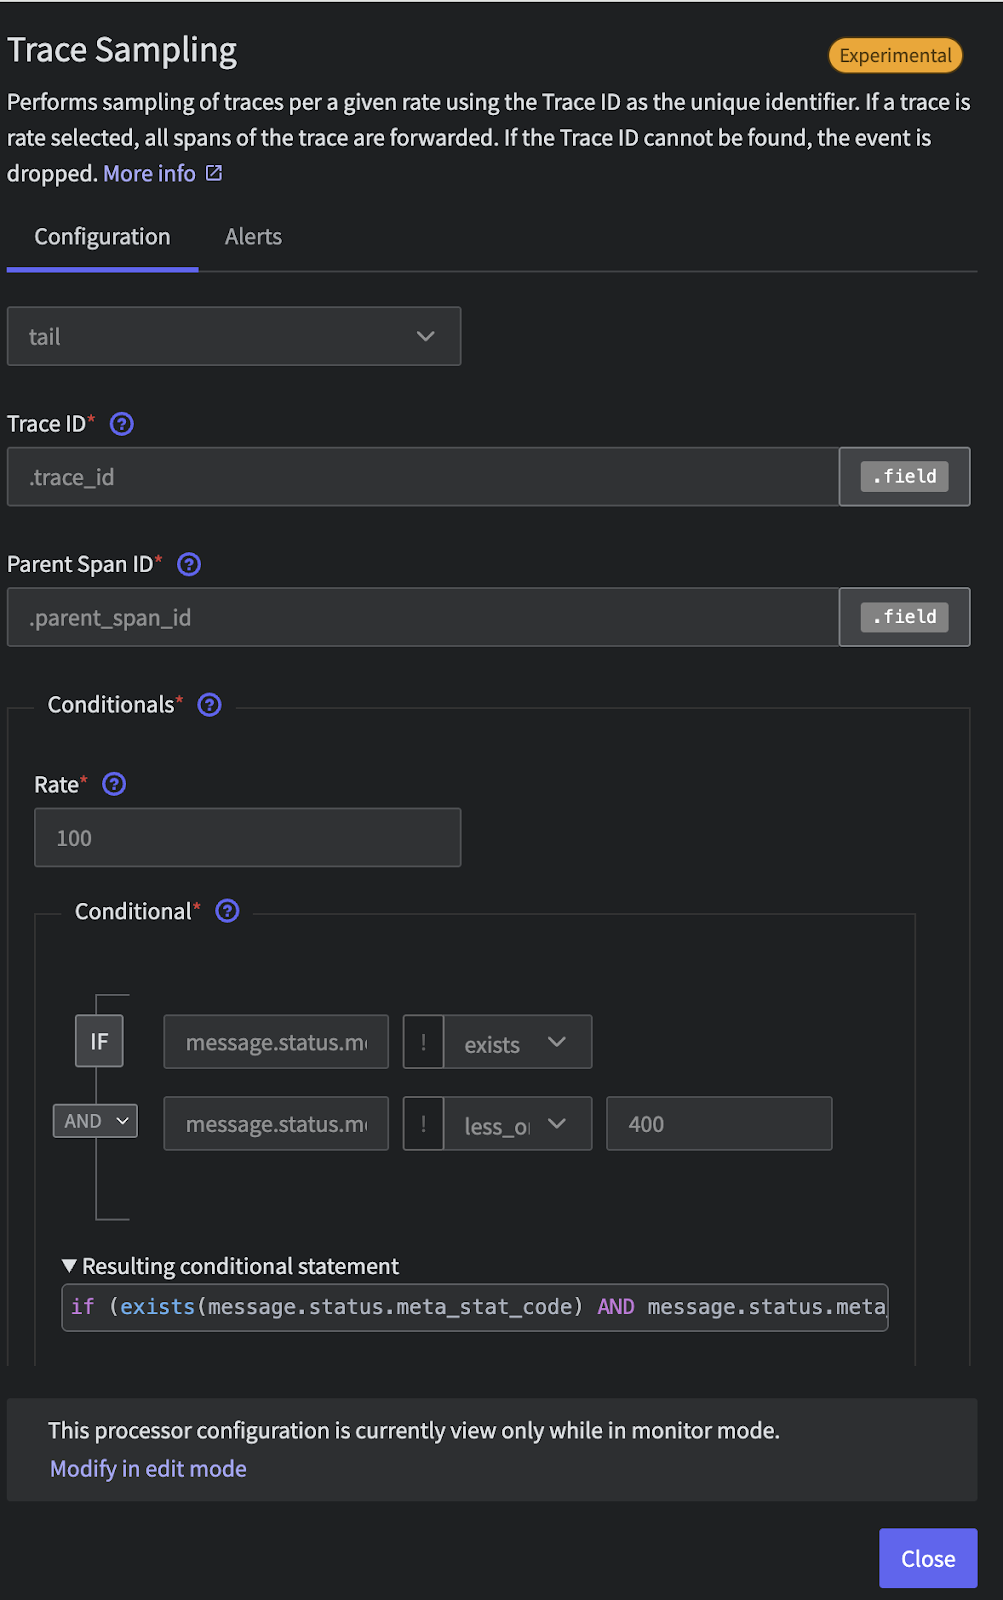
Instead of random head based sampling and hoping for the best, you can sample intelligently. Mezmo’s Tail-Based Sampling is designed for this exact problem. It analyzes 100% of your traces and then makes a smart decision: it guarantees the capture of the traces that actually matter—the errors, the outliers, the high-latency requests—while discarding the repetitive noise. You cut your tracing bill dramatically without ever losing the critical signals you need to debug effectively.
The Real Game-Changer: Making Cost-Control Risk-Free
Here’s the thought that keeps every engineer from being more aggressive with cost-cutting: "What if I throw away something I'll need later?" This fear is valid, and it’s why we over-collect and over-spend.
This is where the entire paradigm shifts. Mezmo’s Responsive Pipelines feature a 4-hour buffer of all your raw, original telemetry.
Let that sink in.
You can set aggressive, cost-slashing aggregation and sampling rules with complete confidence. Why? Because if a deep, complex investigation requires you to see the original, unfiltered data, you can just go back and re-process it on-demand from the buffer. It’s an undo button for your data filtering. This safety net single-handedly de-risks the entire process of observability cost management.
Your Bill is a Design Choice
Your observability bill isn't a fixed law of nature. It’s the output of a system. For too long, that system has been designed to benefit the vendor. By inserting a control point before your data gets there, you can redesign that system to benefit you.
Stop simply feeding the beast. Take control of your telemetry pipeline, shape your data with intention, and start making choices that align with both your technical needs and your budget. The visibility you need doesn't have to cost a fortune; you just have to be clever about how you get it.
More blog posts