From alert to answer: a hands-on investigation with trace analysis in Mezmo
Authored by Sven Delmas, VP of Research at Mezmo
I wanted to know what Mezmo's new trace features feel like with real telemetry behind them, so I built the smallest honest rig I could: the OpenTelemetry demo application running in a local Kubernetes-in-Docker cluster on my machine, one collector, and one deliberately simple Mezmo pipeline. This is the record of that afternoon: the setup, the pipeline, the service map the traces produced, one anomalous trace walked span by span to the storage reads under it, and a first look at the investigations the same telemetry feeds. One thing before we start: I work for Mezmo doing research and development, so read this as an insider's walkthrough rather than an independent review.
The rig: a store that breaks on command
The rig is the OpenTelemetry demo, the astronomy-shop sample application much of the industry demos against, running in a local Kubernetes-in-Docker cluster on my machine (if you get a chance to talk to my boss, mention that I really need a new Mac Studio M5 with at least 1 TB RAM). It needs no introduction: microservices in a dozen languages, instrumented end to end, all three signals over OTLP, and a set of feature flags that break it on command, which turns "generate an incident" from a project into a checkbox. Nothing in it is secret; anyone standing up the same rig feeds the same kind of telemetry I fed.
What is worth calling out is the customizations, all of them in the full values file the rig runs, published alongside this post (the start and stop commands to deploy the same cluster I was using are in the runbook comments at the top of that file, and one value is redacted: generate your own SECRET_KEY_BASE for flagd-ui):
- The chart is pinned to 0.40.10. The 0.41.0 release drops the load-generator UI, moves flagd and its UI sidecar to new images, and swaps seven components in for three out — none of them measured by my sizing pass — so moving to it is a deliberate migration, not a version bump.
- Memory limits are raised to at least twice the usage I actually measured. The chart's defaults assume a short-lived demo, one that runs for minutes; on a laptop cluster that stays up for hours, working sets grow past those limits and containers die in OOM restart loops that look like application bugs. If your recommendation service restarts five times in an afternoon, look at its memory limit before you blame the code.
- The Mezmo exporter. The demo already runs an OpenTelemetry collector internally, and Mezmo's collector docs reduce the delta to one otlphttp/mezmo exporter block and three pipeline entries naming it. The ingestion key (in the Mezmo UI under Settings, then Organization, then API Keys) arrives through a Kubernetes secret, because it is the only Mezmo credential in the whole setup and the one thing you must not paste into a blog post.
The pipeline: one source, a few processors, two destinations
On the Mezmo side I kept the pipeline simple. One OTel source accepts all three signals; all you need to do is provide the target URL and the Mezmo ingestion key in the collector as mentioned above. A script processor filters out the noise from flagd, the demo's feature-flag service, which chatters constantly and tells you nothing about the shop. I have that processor in most of my OpenTelemetry pipelines, happy to share the code as well if needed, however it's not strictly needed here. Behind it, route processors put logs, traces, and metrics on their own paths, with payment traffic and error-code traces broken out separately. Logs that survive the filter land in Mezmo Log Analysis; everything else drains into a black hole.
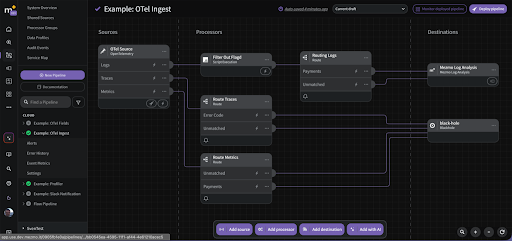
During an early capture window, before the route processors went in, the source was ingesting around 440 kB/s, with about 28 kB/s reaching Log Analysis, about 318 kB/s going to the black hole, and the flagd filter eating most of the rest. That ratio is the point: most raw telemetry exists to be aggregated or discarded, and deciding that in the pipeline instead of at the destination is what keeps the analyzed volume small.
The under-appreciated property here is that the pipeline multiplexes. Plenty of systems can only emit to a single endpoint, and plenty of destinations rate-limit what they accept. Once the stream enters the pipeline, sending traces to one place, filtered logs to another, and everything to an archive is a wiring decision, not an engineering project. I have one source and two destinations only because that is all this rig needs.
The service map: structure you did not draw
So now for the actual fun stuff. Feed traces through the OTel source and Mezmo builds a service map from them: the call structure of the reporting system as the traces actually exercised it, inferred from spans rather than drawn from a diagram someone has to maintain. My map shows the demo's services as a graph, frontend fanning out to image-provider, product-reviews, recommendation, checkout, ad, and email, with anomalous paths drawn in red.
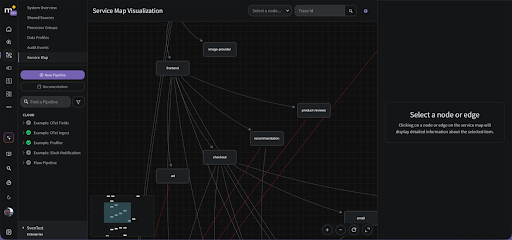
Selecting a service opens a details panel with its incoming and outgoing edges and per-operation latency. Not bad for no extra wiring and no extra development. It's not gonna replace architectural diagrams, but when you look for basic relationships in the system it's great. This also serves as the interface into the actual traces as you will see shortly.
Anomalous traces: from red edge to storage read
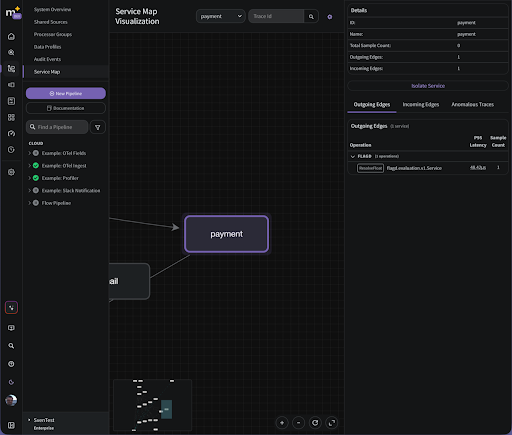
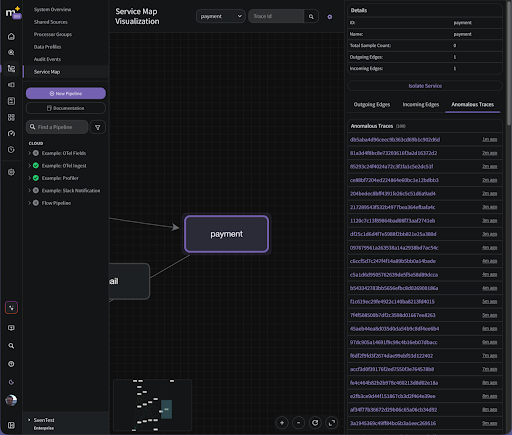
The details panel carries an Anomalous Traces tab, and for payment it held 100 flagged traces during my session, newest first.
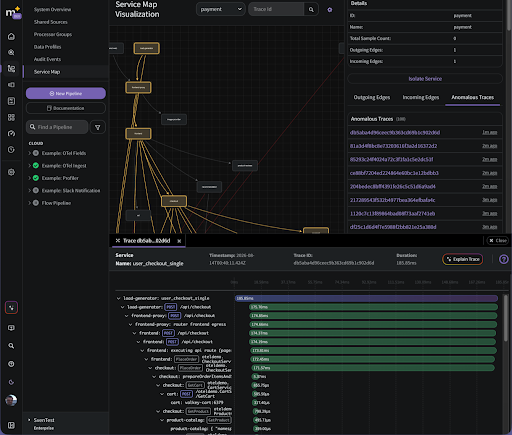
I opened the newest: a checkout request that took 186 milliseconds, walked span by span from the load generator through frontend-proxy and frontend into the checkout service's PlaceOrder, then down through the cart lookup (a Valkey read at 317 microseconds) and product-catalog reads in the hundreds of microseconds. The whole path on one screen, slow spans visually distinct from fast ones, with the trace ID and timestamp right there if I need to go deeper elsewhere. Whether that trace deserved its flag is the detector's judgment, not mine; what I am showing is how fast the inspection goes once something is flagged.
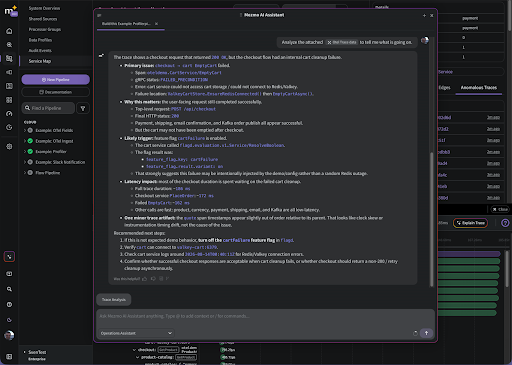
The trace panel also has an Explain Trace button that hands the spans to the Mezmo AI assistant. For this checkout trace it came back with the kind of analysis that takes a human ten minutes of span reading: the request returned 200, but the cart cleanup inside it failed, an EmptyCart call dying with FAILED_PRECONDITION because the cart service could not reach its Valkey store; most of the trace's duration was spent waiting on that failed call; and the span attributes record the cartFailure feature flag as enabled, its hint that the failure was injected by configuration rather than a real outage. That reading is exactly right for this rig, because injected failure is what the demo's flags are for. At some point soon I hope to write a blog about why this is a problem though, as you can imagine, having all the failure injection code and reporting in your benchmark or test is tainting the results quite heavily.
To be clear about what this is: the trace interface is not intended to replace something like Jaeger. It is built for quick and easy introspection, the thirty-second "what did this request actually do" question, asked in the same tool that already holds your logs and metrics. For deep trace forensics you will still want a dedicated tracing backend, and the pipeline above will happily feed one in parallel. We will get to what all that data can do for you next when we start talking about investigations.
Where this is heading: agents and investigations
Everything the rig ingests, traces, metrics, and logs alike, is also accessible through the Mezmo MCP server. That matters because it makes the whole dataset available to AI agents: point something like AURA, Mezmo's open-source SRE agent, at the MCP and its investigations can draw on the same telemetry you just watched arrive. An agent diagnosing an incident is only as good as the data it can reach, and this is the mechanism that widens it.
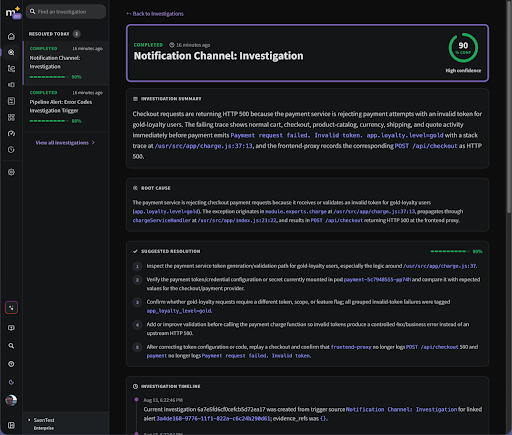
The investigations capability in Mezmo builds directly on that foundation, and my session shows its shape. Two investigations sat in the account's list, both run automatically: one fired from a notification channel, the other from a pipeline alert on trace error codes.
The work behind both is done through AURA: the trigger notifies the AURA investigation service, the agent investigates, and the resulting report lands on the new Investigations page, where every report follows the same layout:
- Title — names where the investigation spawned: Notification Channel or Pipeline Alert.
- Confidence Score — how confident the LLM is in its determination.
- Summary — what was found.
- Root Cause — what the LLM determined was the root cause.
- Suggested Resolution — the LLM's list of steps to resolve it.
- Timeline — the steps the LLM took in its analysis.
- Trigger Condition — optional; when the investigation was triggered from an alert, the matching criteria that spawned it.
- Linked Investigations — other investigations from the past week determined to be related, listed for easier access.
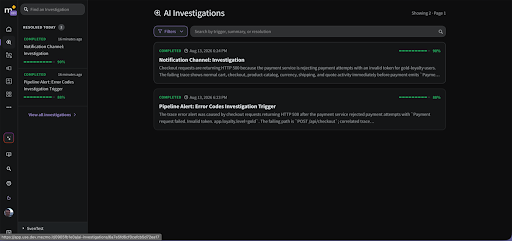
Both landed on the same diagnosis: checkout requests returning HTTP 500 because the payment service rejects payment attempts with an invalid token. The detail view pins the root cause to the charge function in the payment service's charge.js, walks the propagation out to the frontend proxy's HTTP 500, attaches a five-step suggested resolution, and scores its own confidence, 90 percent on one run and 88 on the other. The report is the agent's determination and the confidence score is its own self-assessment. What the rig demonstrates is the path from an erroring trace to a structured, checkable diagnosis without a human in the loop; judging that diagnosis is still your job. The "answer" in this piece's title is exactly that — a root-caused, confidence-scored hypothesis that arrives in minutes and comes ready to be checked, not a verdict you have to trust.
The trigger: a route, an alert, a payload
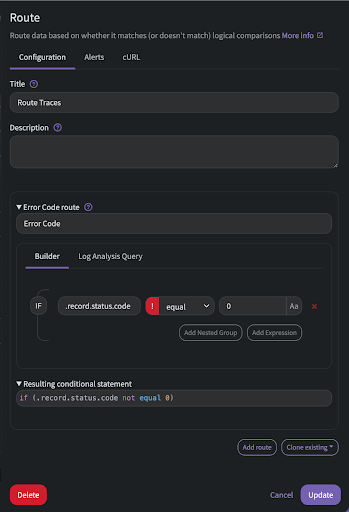
The pipeline alert that fired the second run is worth pausing on, because the whole trigger is configuration, not code. The basic setup: a router carries a route that detects a problem in the system. A problem can be anything; I went with traces that report an error code. The Route Traces processor carries an Error Code route matching .record.status.code not equal 0, so any trace record arriving with a non-zero status peels off onto its own path. One nuance worth knowing: the field carries the raw OTLP status enum (UNSET=0, OK=1, ERROR=2) — Mezmo does not normalize it — so a span whose instrumentation sets an explicit OK would ride this route too. In practice non-zero means error, because the OTel spec tells instrumentation to leave successful spans unset. Other triggers are just as easy to set up: as part of this exploration I also added the log and metric routers, configured to trigger on specific error logs and on metric absence respectively.
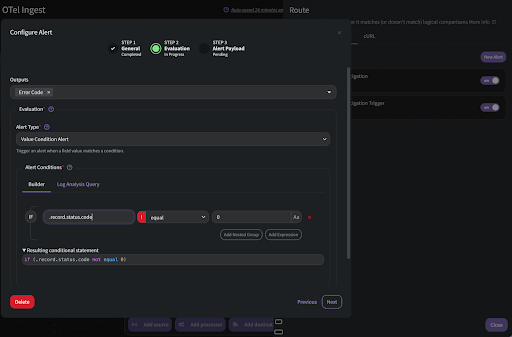
On that route's output sits a value-condition alert with the same condition.
The alert's payload is where the investigation starts: its service is Mezmo AURA Investigation, its message is "We received traces with errors, investigate.". An erroring trace matches the route, the alert fires, and an investigation like the one you just read runs without anyone clicking anything.
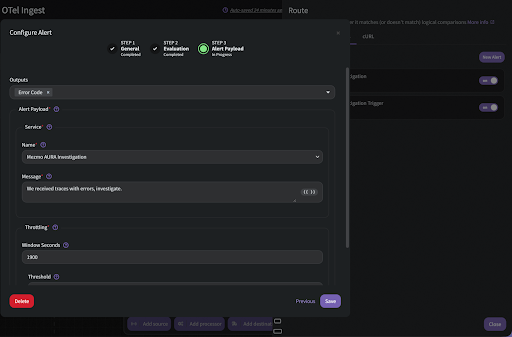
There is also a throttling mechanism that ensures investigations don't overlap and don't fire too frequently; right now that mechanism actually ignores the alert's throttle setting and implements a hard backend throttle, currently set to 30 minutes — tokens are expensive. That suppression warrants some more fine-tuning when it hits production pipelines: in all likelihood we will want to offer a way to mark and track recurring events rather than only suppressing them.
What to know before you try this
Most of this piece is generally available. As I write this in August 2026, the single OTel source that takes logs, metrics and traces together, the service map it builds, the anomalous-traces view and Explain Trace are all shipping product. Point the rig at your own account and you will see what I saw. Trace analysis through the Mezmo AI assistant is publicly documented.
Investigations is the exception. It runs in production but sits behind a per-account feature flag while Mezmo gathers feedback, so a stock account will not show the investigations list or the Mezmo AURA Investigation alert service yet, and both may change before general availability. The screenshots here come from a development environment. Everything else the rig needs is open source or public: the OTel demo, the collector exporter in Mezmo's public docs, Mezmo Telemetry Pipelines, the Mezmo MCP server, and AURA.
References
- OpenTelemetry Demo documentation and the demo repository
- OpenTelemetry Demo feature flags
- OpenTelemetry Collector configuration
- Mezmo docs: OpenTelemetry Collector setup
- mezmo-collector-values.yaml, the rig's full collector values file with the setup runbook in its header comments
- Mezmo documentation
- AURA, Mezmo's open-source SRE agent (Apache-2.0)
- Mezmo MCP server and its documentation
- Jaeger, the CNCF distributed tracing platform
More blog posts