
Log Analysis, reinvented with Active Telemetry
Unlock real-time analytics, cut storage costs dramatically, and drive smarter decisions with high-fidelity logs — instantly.
Log smart, save big
Enable operational AI in minutes with context engineered data sets. Give your agents simple prompts with context fueled accuracy reducing the window of failure to almost none.
Give devs the flexible use of AI to access and act on any high-context telemetry, right within their workflows for a superior experience—without putting budget, performance, or control at risk.
Process telemetry in-stream to accelerate Root Cause Analysis (RCA) with an agentic SRE. Extract key information and spot anomalies with full context – before data is ever stored.
Direct data with intent, reshape and normalize for agentic and human consumption, including "easy button" migration to Open Telemetry. Separate signal from noise by its value, triggering automated actions to dodge spikes or flag faults in real time.
- Get real-time insights from the moment logs are created, no waiting for ingestion delays
- Slash noise by only storing what matters by filtering outs verbose, low-value logs before storage
- Visualize trends and set powerful in-stream alerts for proactive monitoring
See the signal, skip the noise
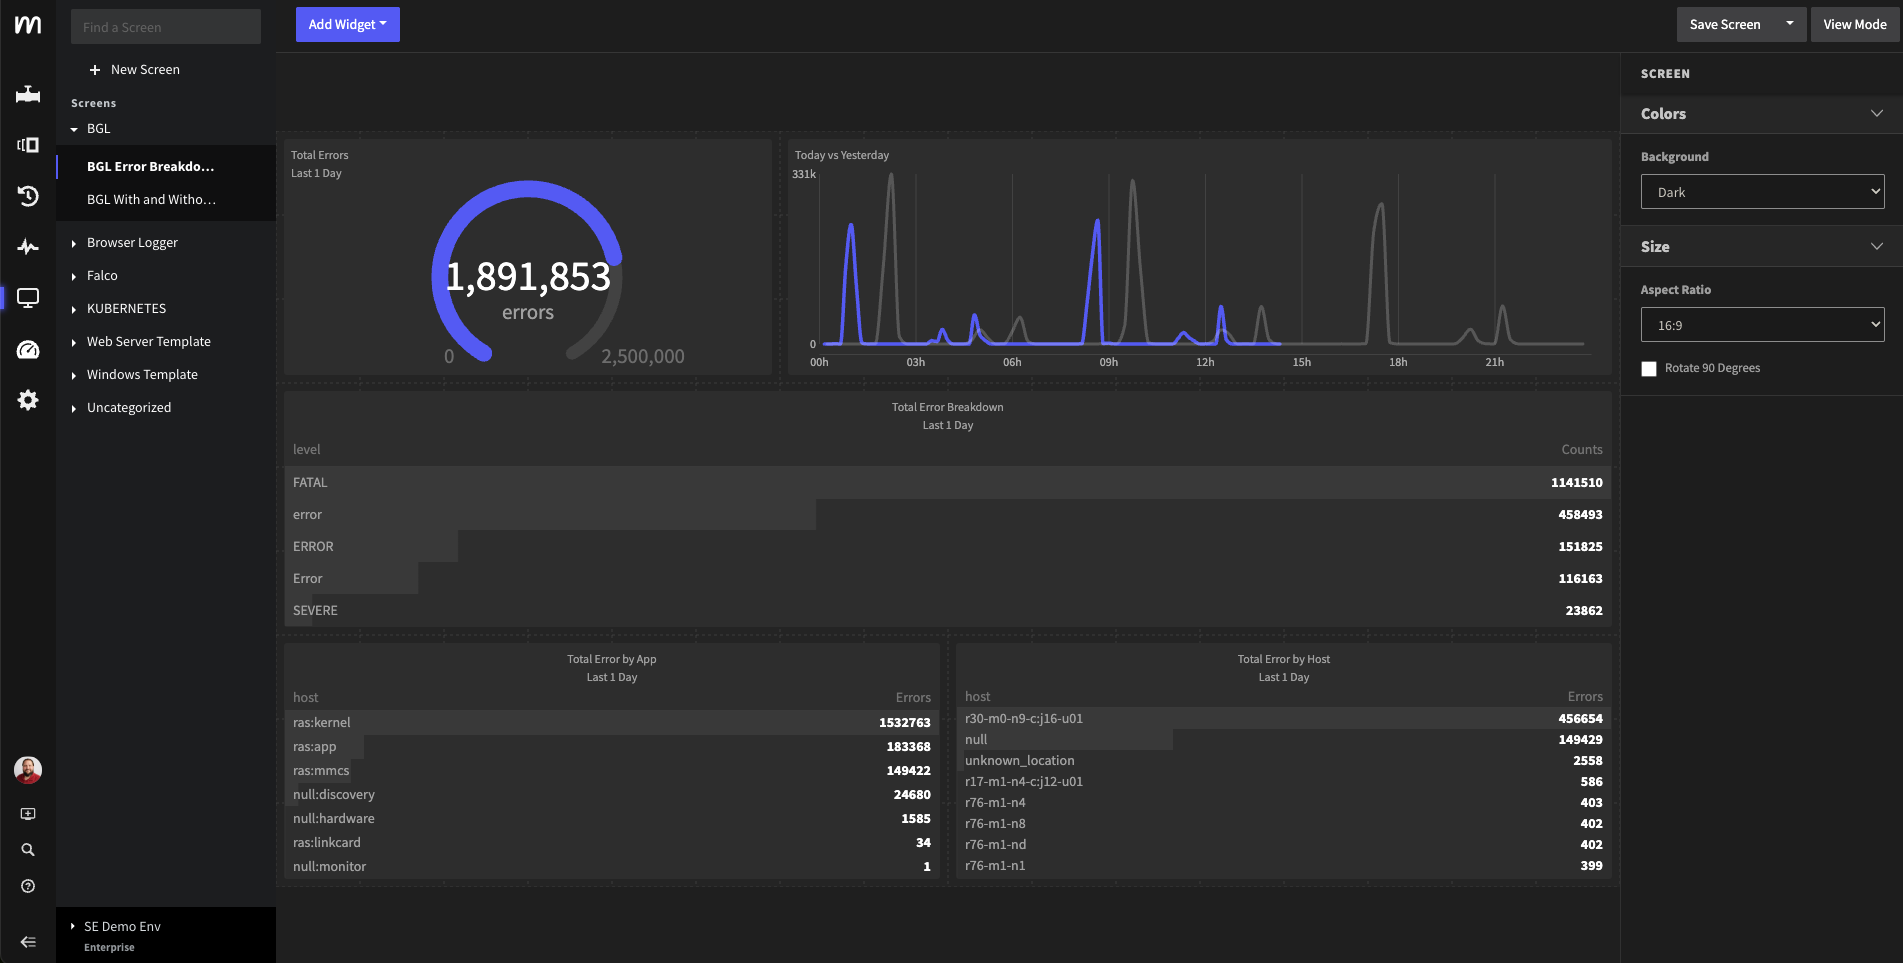
Intuitive UI and query language for fast root-cause analysis.
Visualize critical metrics with out-of-the-box and custom dashboards.
Threshold, change, and absence alerts in-stream and at rest.
Add contextual metadata for Kubernetes logs automatically.
Collect in any format, then transform or aggregate pre-index.
Discover structure and patterns, aiding downstream optimization.
Fit seamlessly into your ecosystem. Learn which sources and destinations we support
Key capabilities for Log Analysis
Remove low-value logs (DEBUG/INFO) to reduce noise and manage costs effectively.
Decide what stays hot, what moves to cold storage (S3, Azure Blob, GCP), or gets dropped.
Redact, encrypt, or mask sensitive/PII data before reaching consumers.
Add labels and context inline before routing to destinations.
Alerts and real-time deviations trigger automatic routing adjustments.
Hold raw logs in a short-term buffer for on-demand replay.
Real-world use cases for Log Analysis
reduction
"Mezmo helped us reduce our overall telemetry data volume by 50% by filtering and parsing data to ensure we only indexed the fields we actually needed."
— Netlink Voice
"Teams using Mezmo consistently reduce mean time to resolution by 30-50% through cleaner, more relevant data feeding into their observability platform."
— Platform Engineering Team
"Using Data Profiler, we discovered we were sending massive amounts of verbose health check logs. Mezmo helped us create cost metrics and optimize our pipeline."
— Schier Engineering
Explore more
Stop paying to store noise
Start capturing signals
fixing issues — all from Live Telemetry.
