Trace an AI SRE Agent: AURA Docker Quickstart with Phoenix
A big tool result does not have to be a big context cost. AURA moves it to disk and hands the model a pointer plus the tools to navigate what is there.
- Learn more about AURA → https://www.mezmo.com/aura
- Get started today → https://github.com/mezmo/aura
- Get deployment help→ https://www.mezmo.com/contact
A large MCP tool result can consume or overflow an agent's context window, and on a third-party server you do not control how much comes back. Scratchpad breaks the link between how big a tool result is and how much context it costs: the full output goes to disk, and only the slice the model asks for ever enters the window. Errors always pass through inline, so the model can react to them.
Every tool result is token counted with the tokenizer matched to your model, and interception fires at the threshold you set for that tool. Eight structure-aware exploration tools do the reading: schema maps keys and types to line ranges, item_schema finds every field across an array, iterate_over works like a select statement over the items, and get_in, grep, head, and slice handle targeted extraction. A large markdown report buried inside a JSON string is pulled into its own companion file, with sections mapped to line ranges the model can slice.
Extraction is capped too. Every request is token counted against a per-call cap and the remaining window before it runs, and an oversized one is refused with suggestions to narrow the range, paginate, or request fewer fields. That costs one turn instead of a guessing spiral.
Setup is two additions to your TOML: enabled = true under agent.scratchpad, and per-tool thresholds on the MCP server. Thresholds are glob patterns and the most specific one wins. Turn it on for tools that can return unbounded output, such as log queries and list-everything endpoints, and skip small bounded tools where interception is pure overhead. AURA reports tokens intercepted versus tokens extracted in the CLI and emits token usage in SSE events.
AURA Scratchpad is built for SRE and platform engineers who need an agent to work against MCP servers they do not control, without a single oversized tool result deciding how much context is left.
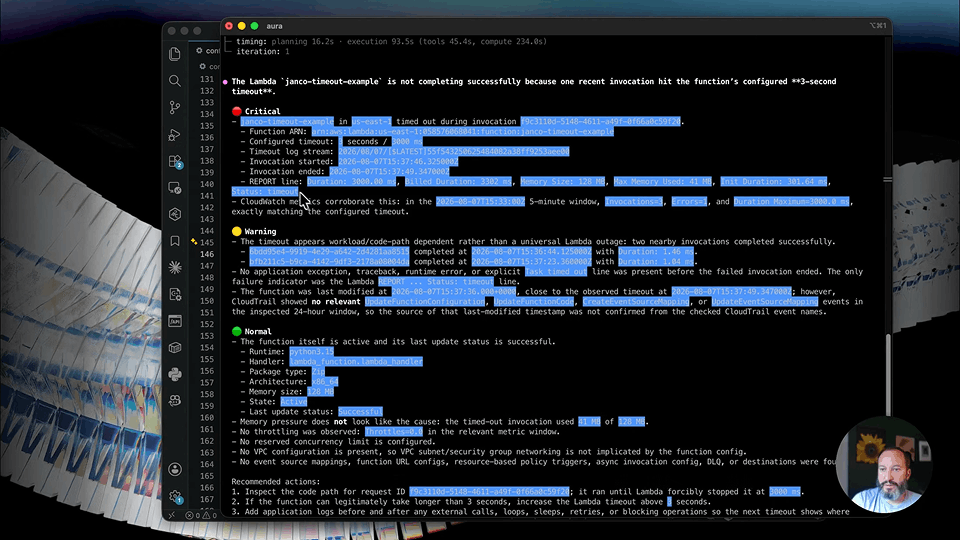
The demo at the end runs a root cause analysis over the last five minutes to show Scratchpad working, not to reach a finding: no cause is named on camera, and AURA reports rather than acts in this video. What it does show is thousands of tokens intercepted on one run, with the speaker noting that not every run reduces consumption that sharply.
0:00 Why a big tool result costs the context window
0:13 What Scratchpad does
0:30 Token counting and per-tool thresholds
0:48 Eight structure-aware exploration tools
1:12 Structured strings become companion files
1:27 Capping extraction against the context budget
1:48 Tokenizer support by provider
1:58 Which tools to enable it on
2:17 Tokens intercepted versus tokens extracted
2:30 Two additions to your TOML
2:44 Running it live
3:19 What a typical run looks like
3:33 Recap
#AISREAgent #ContextEngineering #PlatformEngineering
Transcript
What an AURA trace shows
0:00 You're looking at a trace generated by AURA. OpenTelemetry to Phoenix records the route through the system, how long each part took, and how much it cost. You can do this yourself with our Docker-based quickstart.
The four services in the Docker quickstart
0:10 The Docker quickstart runs four services:
aura-web-serveris our persistent agent harness.- LibreChat gives us a browser interface for chatting with the agent.
- Phoenix receives the OpenTelemetry spans emitted by our agent harness.
- MongoDB is also there to store stateful data for LibreChat.
The Docker Compose file comes pre-configured to point AURA at Phoenix, and enables content recording for this local demo.
Clone, configure, and start the stack
0:33 To get going, clone the AURA repo. From the root of the repository, copy the example environment file, choose the provider and model, then add an API key.
Once you're ready, run docker compose up -d. Docker pulls the latest images and starts the stack on your local network. LibreChat comes online after the health check in the Docker container passes. Phoenix starts alongside them and listens for traces.
LibreChat on port 3080
0:56 Once the stack is running, we'll continue with two browser interfaces. LibreChat is listening on port 3080. On the first visit, you'll have to create a local account to continue, but nothing will persist after you tear down and delete the Mongo container.
Two requests and a direct response
1:10 For this demo, we'll send AURA a short test request first. Then we'll give the coordinator an incident with just enough evidence to choose a route. Even though the stock AURA configuration has no MCP servers, the coordinator will still analyze information supplied in the prompt, which in turn generates enough trace data for us to follow.
For this run, the AURA coordinator chose to respond directly. That decision is part of the trace, so we'll inspect the route over in Phoenix.
Two traces per request in Phoenix
1:35 Point a browser at Phoenix on port 6006. The four newest entries came from the two requests we just sent. You'll see that AURA created two traces for each request.
The HTTP trace covers the request and response lifecycle. Its chain begins at chat_completions. If the client disconnects or streaming stalls, this is where you'll see it.
The actual agent work lives in a separate trace, rooted at agent.stream. AURA starts this as an independent root, keeping the full execution together.
Expanding the agent.stream span tree
2:03 Open this up and expand the tree. The orchestration span contains the coordinator's route. Under it, orchestration.planning records the planning call. The next branch is agent.stream_chat, followed by agent.turn for the model interaction. This run ends with an execute_tool span named respond_directly.
Reading the execute_tool attributes
2:22 Open its attributes. You'll see that the routing rationale says all three workers lack MCP access, while the prompt already contains enough evidence for a useful analysis. The output then confirms that the direct response was recorded.
Note that this execute_tool span is an internal AURA action, not an MCP request.
Where a real MCP call appears
2:42 After you configure an MCP server, a real external call will appear as mcp.tool_call nested below the execution span. Also note that the trace details include the incident prompt and AURA's response. Always double-check for sensitive data before sharing a trace.
OpenInference span kinds and header fields
2:58 Phoenix also attaches OpenInference data:
CHAINmarks request flow and orchestration.LLMmarks model turns.TOOLmarks an action such asrespond_directlyor a configured tool call.
If the provider reports status, latency, token usage, and cost, then the trace header will include them. These fields make it easier to find slow or expensive branches without opening every span.
Following the route behind a response
3:23 OpenTelemetry traces record the route behind every AURA response. If you open agent.stream, you can follow it through the trace. Now, when AURA gives you an answer, you can see what it actually did.
More videos