
How to Use JSON Logs
• Understand the benefits of saving logs in the JavaScript Object Notation (JSON) format
• Learn how to enable Rails applications to log in JSON
• Understand how to send JSON logs to Mezmo
It is becoming increasingly common for developers and observability tools to store logs in the JavaScript Object Notation (JSON) format. Many programming languages have native or add-on libraries that provide an easy way to parse standard text logs to JSON, which has helped popularize JSON logging within the developer community. This tutorial will explain some of the benefits of logging in JSON. In addition, we will show you how JSON logging works using Mezmo's monitoring service and a sample Ruby on Rails application.

Why Save Logs in JSON?
The main reason to use JSON for your logs is that it gives them a structured format that can be searched and filtered by key and/or value, which offers more possibilities than a simple text structure that is only searchable by value.
The JSON format is both human- and machine-readable. If you take a look at a JSON log file, you'll be able to quickly understand the schema and possible values allowed for each key. In addition, artificial intelligence and machine learning software can use the schema to identify patterns and prepare data for advanced monitoring.
JSON also enables the unification of logs from multiple sources, which reduces the complexity of working with diverse log formats. You can create a default schema for a JSON log that you will use to validate the JSON file after the parser.
Enabling Rails Applications to Log in JSON
Lograge is a third-party gem for Rails parser logging. It rewrites the logs to allow you to create a new log definition with only the information that makes sense for your application and context. Let's see how it works.
First, create a new Rails application:
Then, add Lograge as gem:
This will add the following line to your Gemfile:
Now, create a lograge.rb file inside the config/initializers directory and add the following code:
Handling Exception Logs
Since the idea is to store all logs in JSON, we will need to create a method inside the ApplicationController class (app/controllers/application_controller.rb) to handle the "route not found" issue:
Then, you need to include a new route in config/routes.rb to redirect exceptions to the method that we created in the ApplicationController:
The last step is to create a view to be shown when an exception occurs. First, create a folder called error_pages inside app/views, then create an HTML file called 404.html. You can add your exception message to this file.
This implementation will handle all exceptions by generating an entry in the JSON log. If you start the Rails server and try to access http://localhost:3000/any-path, you will see an error log like the one below. (The ROUTE-NAME is the non-existent path that you attempted to access.)
Adding the Happy Path
You need to add some routes to respond and test the log. First, create a new controller called home with the index action. This process will also add the route to config/route.rb:
Then, create the views to finish redirecting the route. Make a new folder called home inside the app/views directory and a new (empty) HTML file called index.html inside the app/views/home directory.
Now, restart the Rails server and try to access http://localhost:3000/home/index. If you've done everything correctly, you will see something like this:
Sending JSON Logs to Mezmo
The easiest and fastest way to start sending your application logs to Mezmo is to deploy your application to Heroku and enable the Mezmo Heroku add-on. You can find guidance on the entire process of deploying your Ruby on Rails application to Heroku on this Heroku documentation page.
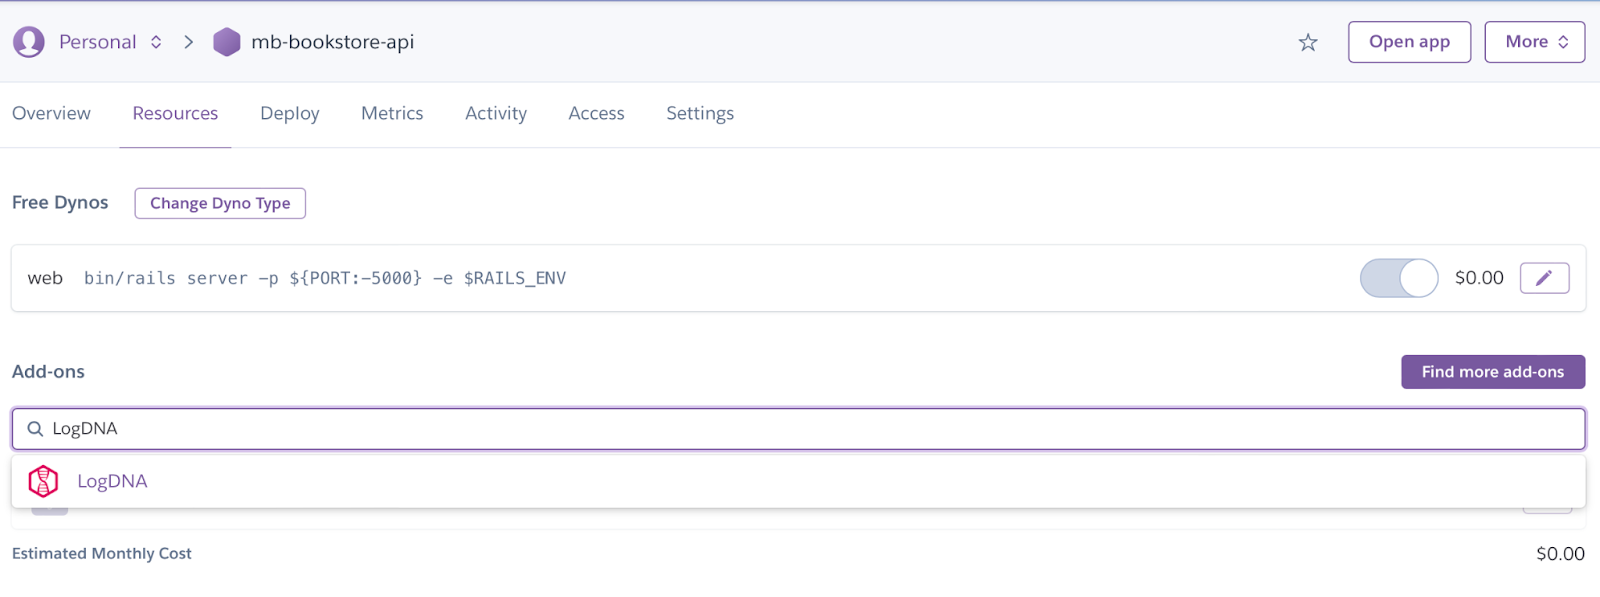
Once you've deployed your application to Heroku, go to your app's Heroku page and click on the Resource tab to add Mezmo as an add-on. Just type "LogDNA" in the search field and select the options below.
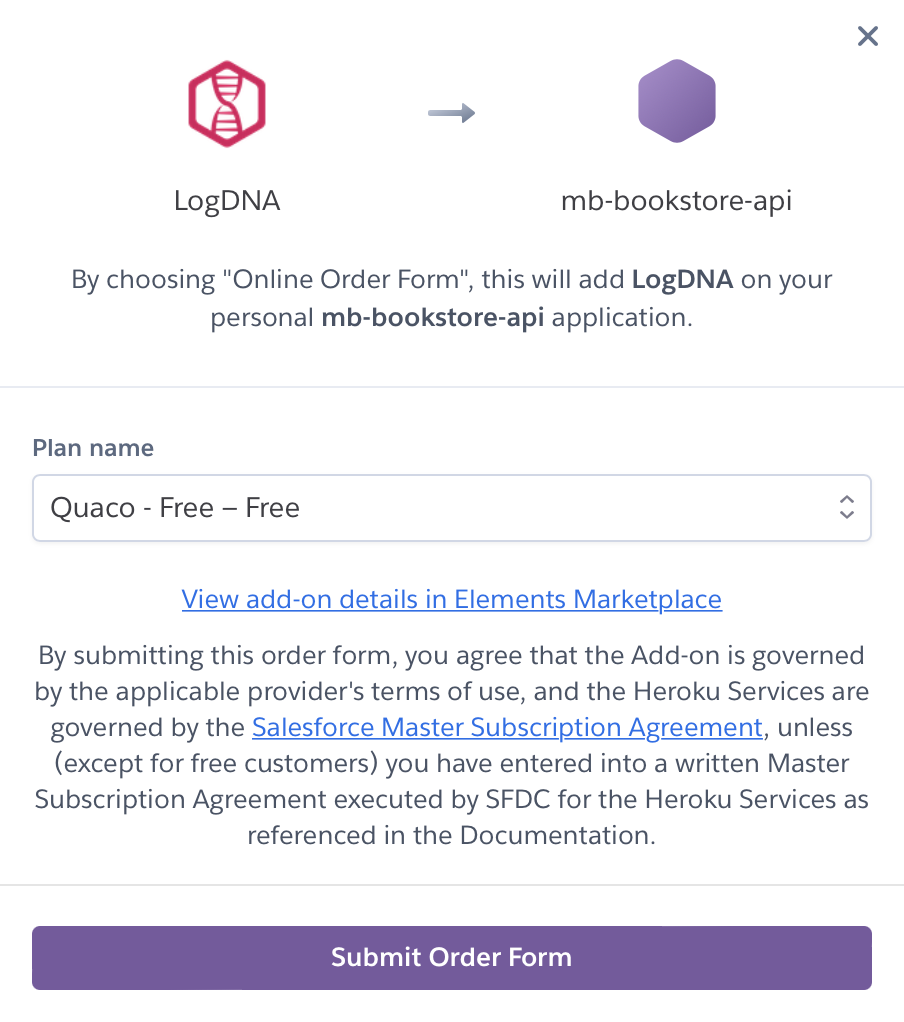
To enable LogDNA in your application, choose your plan and click on Submit Order Form in the confirmation modal.
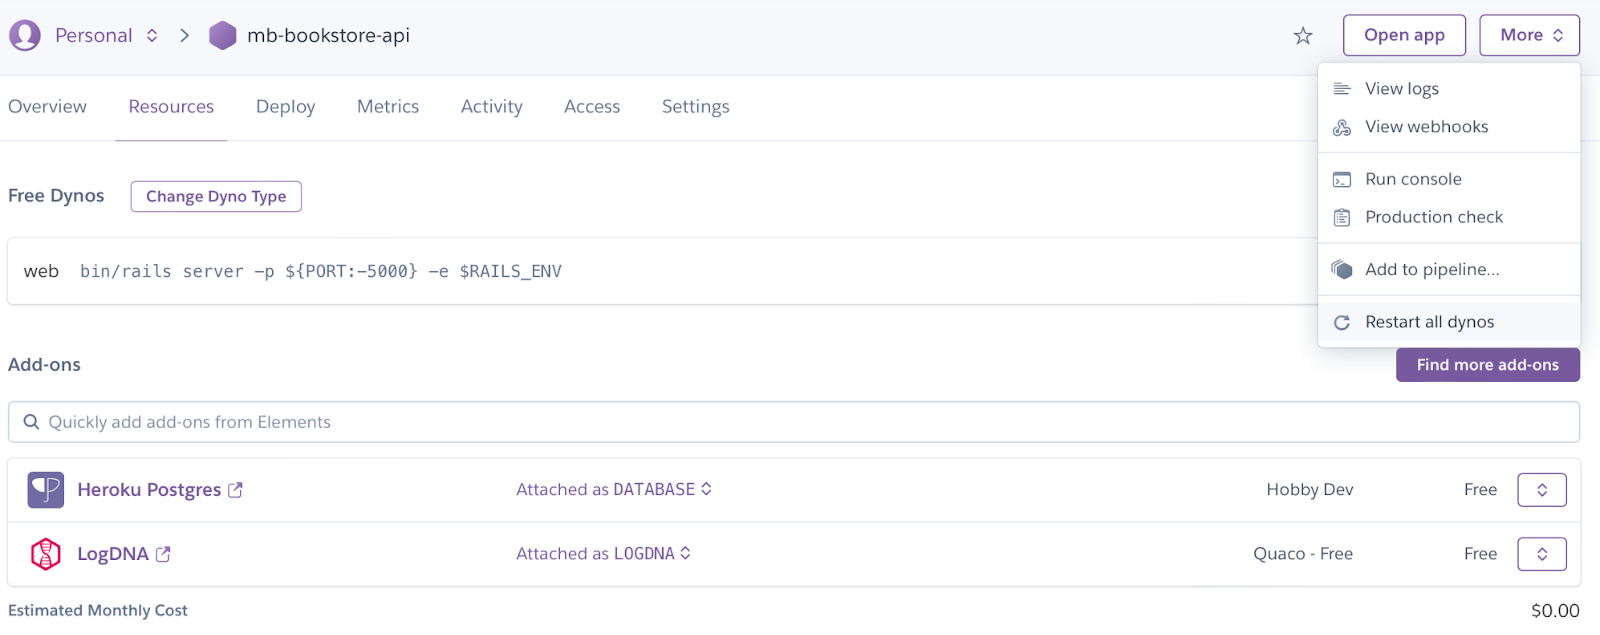
Finally, you need to restart your dynos to apply the Mezmo inclusion. Click on the More button, then choose Restart all dynos. After resuming the dynos, your application logs will be available in Mezmo, which you can access by navigating to your add-ons list and clicking LogDNA.
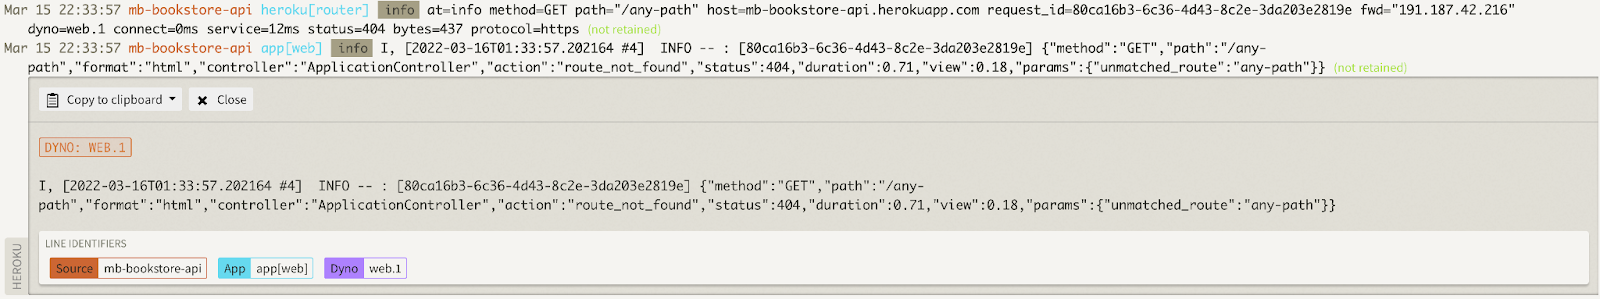
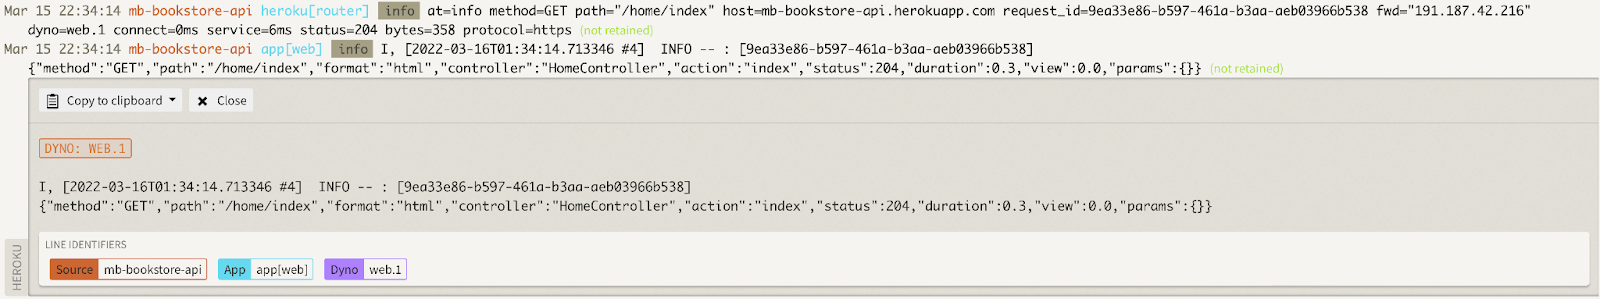
On the Mezmo page, you will see the JSON logs that we used in the previous section.
For example, the failed route looks like this:
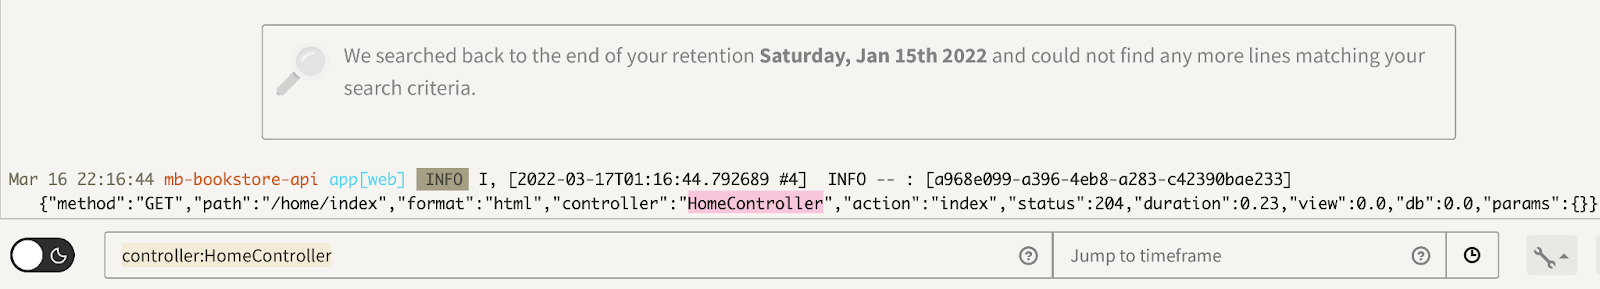
And the successful route looks like this:
Mezmo has powerful log search capabilities, especially if you are using JSON. It allows you to perform a key:value search, and it can autocomplete to make searching easier. You can also use other logical operators to filter according to more detailed criteria.
In addition, Mezmo has an automatic JSON parser for many types of logs, saving developers a great deal of time. To learn more about performing advanced queries with JSON parsing, look at the Mezmo documentation. It is also possible to use the libraries developed by Mezmo to perform parsing and integration with different languages.
Conclusion
As observability becomes increasingly essential for modern applications, the tools and processes for gaining these insights also improve. New methods of monitoring and tracking enable developers and DevOps teams to find and fix issues faster.
At the same time, JSON has become the de facto standard format for logging. More and more applications use JSON logging from the start, while older application logs need a conversion to JSON. Mezmo uniquely positions itself to help your organization take full advantage of JSON logging and its many benefits, whether you are updating an older application or building one from the ground up.
Related Lessons
Share Article


Ready to Transform Your Observability?
- ✔ Start free trial in minutes
- ✔ No credit card required
- ✔ Quick setup and integration
- ✔ Expert onboarding support
