What an AI SRE agent actually finds when you point it at a broken Kubernetes cluster
Most of the AI features that shipped into observability tools this year summarize alerts. You get a paragraph that restates the dashboard you were already looking at, and the agent never reads the cluster itself, because giving it cluster access is a security conversation nobody wanted to start.
This walkthrough starts it. We wire AURA to live Kubernetes and Prometheus data through read-only MCP servers, restrict each worker to an explicit list of tools, then ask it an open question and watch it go find something we didn't know was broken. It runs on a local KIND cluster, so nothing here touches production, and kind delete cluster takes the whole thing with it when you're done.
The harness is AURA, which we open-sourced under Apache 2.0. Most of the design choices below exist because something broke in production first, and we've flagged the ones that will bite you.
What you're building
The setup uses AURA in orchestration mode, which splits the work across a coordinator and specialized workers rather than handing one agent every tool you own.
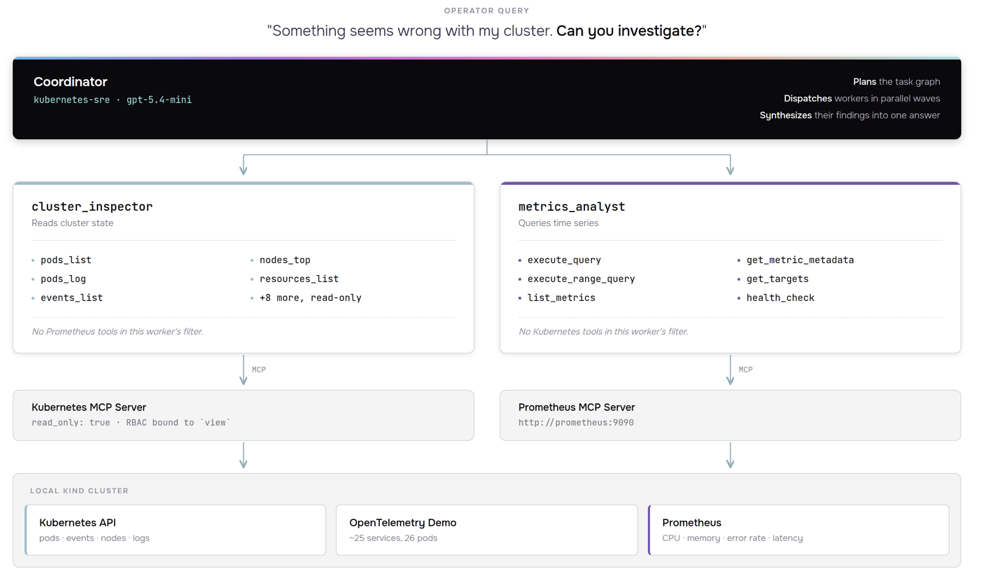
The coordinator receives your question, decides whether it can answer directly or needs to dispatch, and then routes to whichever workers are relevant. cluster_inspector sees Kubernetes tools and nothing else. metrics_analyst sees Prometheus tools and nothing else. Neither can wander into the other's territory, because the tool filter is enforced at config time, not by asking the model nicely in a system prompt.
Prerequisites
- Docker
- kubectl
- kind
- Helm 3.12 or later
gitandjq- An OpenAI API key, or credentials for Anthropic, Bedrock, Gemini, or a local Ollama instance
Sizing, before you start. The OpenTelemetry Demo is roughly two dozen services plus Prometheus, Grafana, Jaeger and OpenSearch, and it is not lightweight under KIND. Budget 16 GB of RAM (Docker Desktop itself set to at least 8 GB, ideally 12, with 4+ CPUs), around 30 GB of free disk, and roughly 10-15 GB of that going to cached container images. The first run spends five to fifteen minutes pulling images before anything is usable. On 8 GB it will technically start, but pods crash in ways that look like configuration problems and aren't. If your laptop is under that, a 4-core/16 GB cloud VM for an afternoon is the cheaper path.
Step 1: Spin up a cluster with something running in it
An agent with nothing to investigate isn't a demo, so start with a cluster that has real workloads emitting real telemetry.
kind create cluster --name aura-sre
The OpenTelemetry Demo gives you a microservices application with Prometheus, Grafana, and Jaeger already wired together. It's a CNCF project, it's what most people benchmark observability tooling against, and it means your agent will be reading genuine service-to-service telemetry instead of a fixture someone wrote to make the demo look good.
helm repo add open-telemetry https://open-telemetry.github.io/opentelemetry-helm-charts
helm install otel-demo open-telemetry/opentelemetry-demo
This deploys roughly two dozen workloads, a full e-commerce application plus its observability stack. It came out to 26 pods on our run. Watch the pods come up:
kubectl get pods -w
You don't need everything Running before you continue. Prometheus is the one that matters for our agent to query metrics, so once that pod is ready we can move on.
Verify Prometheus is available, since the next step depends on it:
kubectl get svc | grep prometheus
If everything is working, you should see something like:
prometheus ClusterIP 10.96.XX.XX <none> 9090/TCP Xm
Look for a service named prometheus on port 9090. If yours is named something else, note it down. You'll reference it when we configure the MCP server in step 2.
Step 2: Give the agent something to reach the cluster with
AURA doesn't talk to Kubernetes directly. It discovers tools over MCP at runtime, which means the agent's capabilities are defined by which MCP servers you point it at rather than by anything compiled into the harness. This is why we can wire up read-only access without forking the agent code.
Install two MCP servers, one for Kubernetes and one for Prometheus:
# Kubernetes MCP Server: read-only cluster access
# Binds the built-in "view" ClusterRole: namespaced resources only, no Secrets.
# nodes_stats_summary and nodes_log need node access view does not grant, so
# they 403. nodes_top starts working once metrics-server is installed.
helm install kubernetes-mcp-server \
  oci://ghcr.io/containers/charts/kubernetes-mcp-server \
  --set ingress.enabled=false \
  --set config.read_only=true \
  --set 'rbac.extraClusterRoleBindings[0].name=view' \
  --set 'rbac.extraClusterRoleBindings[0].roleRef.name=view' \
  --set 'rbac.extraClusterRoleBindings[0].roleRef.external=true'

# Prometheus MCP Server: connected to the OTel Demo's Prometheus
# Override probes to use TCP (the MCP server has no GET health endpoint).
helm install prometheus-mcp-server \
  oci://ghcr.io/pab1it0/charts/prometheus-mcp-server \
  --set prometheus.url="http://prometheus:9090" \
  --set livenessProbe.httpGet=null \
  --set 'livenessProbe.tcpSocket.port=http' \
  --set readinessProbe.httpGet=null \
  --set 'readinessProbe.tcpSocket.port=http'
If your Prometheus service came up under a different name in step 1, swap it into that URL now.
Notice config.read_only=true on the Kubernetes server. The agent can describe pods, pull logs, and read events, but it cannot apply, patch, or delete anything. For a first run against any cluster you care about, that flag is doing more for you than any prompt engineering will. The server only exposes tools annotated readOnlyHint=true, so the write tools are never registered in the first place. That's a different layer from the view ClusterRoleBinding above it, and both would have to fail before anything mutates.
Confirm both servers are talking to their backends before continuing:
kubectl logs -l app.kubernetes.io/name=kubernetes-mcp-server --tail=5
kubectl logs -l app.kubernetes.io/name=prometheus-mcp-server --tail=5

kubectl wait --for=condition=ready pod -l app.kubernetes.io/name=kubernetes-mcp-server --timeout=120s
kubectl wait --for=condition=ready pod -l app.kubernetes.io/name=prometheus-mcp-server --timeout=120s
If both servers connected successfully, you should see:
- Logs showing the server starting and listing available tools (look for tool names like pods_list, pods_get, execute_query)
- Wait commands returning:
pod/kubernetes-mcp-server-xxxxx condition metandpod/prometheus-mcp-server-xxxxx condition met
If you see errors about connection refused or authentication failures, the MCP server couldn't reach its backend. Double-check the Prometheus service name and that both the Kubernetes API and Prometheus are accessible from within the cluster.
Step 3: Deploy AURA
The chart and the quickstart values both live in the repo, so clone it first:
git clone https://github.com/mezmo/aura.git
cd aura
Substitute your own key on the first line. The chart reads it from the environment, deploys the agent with the quickstart's worker config, and the wait blocks until the pod is actually serving:
export OPENAI_API_KEY="sk-..."

helm install aura ./deployment/helm/aura \
  -f examples/quickstart-k8s-sre/aura-values.yaml \
  --set secrets.openaiApiKey="$OPENAI_API_KEY"

kubectl wait --for=condition=ready pod -l app.kubernetes.io/name=aura --timeout=120s
We hit this. On v0.1.8 the chart rendered no command: field. The image has CMD ["./aura-web-server"] and no ENTRYPOINT, so args: ['--verbose'] replaced the CMD outright and the kubelet tried to exec --verbose as a binary: exec: "--verbose": executable file not found in $PATH. Fixed in v0.1.14, which added command/args defaults to the chart, so the install above needs no override. Pinned below that, add --set-json 'server.command=["./aura-web-server"]' --set-json 'server.args=["--verbose"]'.
To swap providers, edit the [agent.llm] block. It takes OpenAI, Anthropic, Bedrock, Gemini, or Ollama, and the tool wiring underneath doesn't change when you switch.
The quickstart ships with provider = "openai" and model = "gpt-5.4-mini", with the key read from the environment via api_key = "{{ env.OPENAI_API_KEY }}". Workers inherit that block unless they declare their own [orchestration.worker.<name>.llm], so one edit changes the model everywhere.
Production note. We default examples/quickstart-k8s-sre/aura-values.yaml to image.tag: "latest", which is the wrong default for a reproducible run. You get whatever latest resolved to on the day you ran it. Pin it to a release tag instead, and record the digest you actually got:
kubectl get pod -l app.kubernetes.io/name=aura \ -o jsonpath='{.items[0].status.containerStatuses[0].imageID}'Step 4: Ask it something
The mezmo/aura image ships two binaries: the server (aura-web-server, which is what the Helm chart runs) and the CLI (aura). So you don't deploy anything new. You exec the CLI into the pod that's already running:
kubectl exec -it deploy/aura -- ./aura --api-url http://localhost:8080
That drops you into an interactive REPL. Before breaking anything, ask it for a baseline:
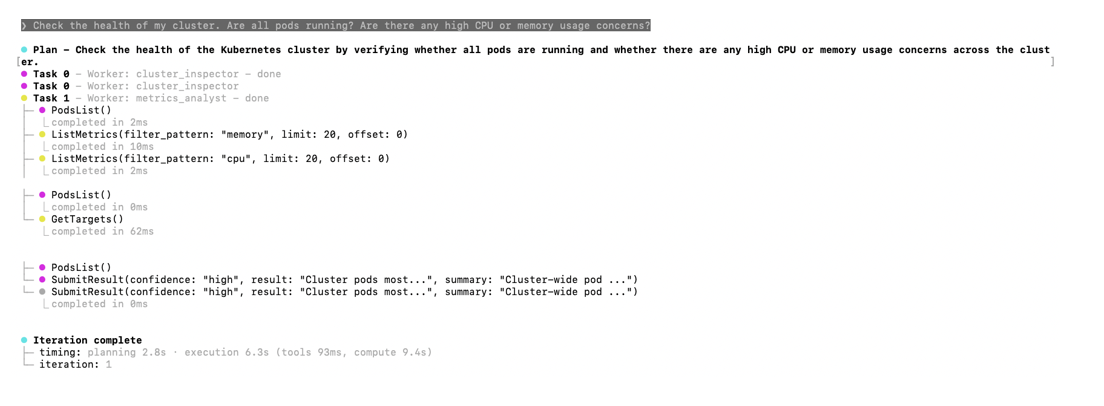
Check the health of my cluster. Are all pods running? Are there any high CPU or memory usage concerns?
This was supposed to be the boring step. It wasn't.
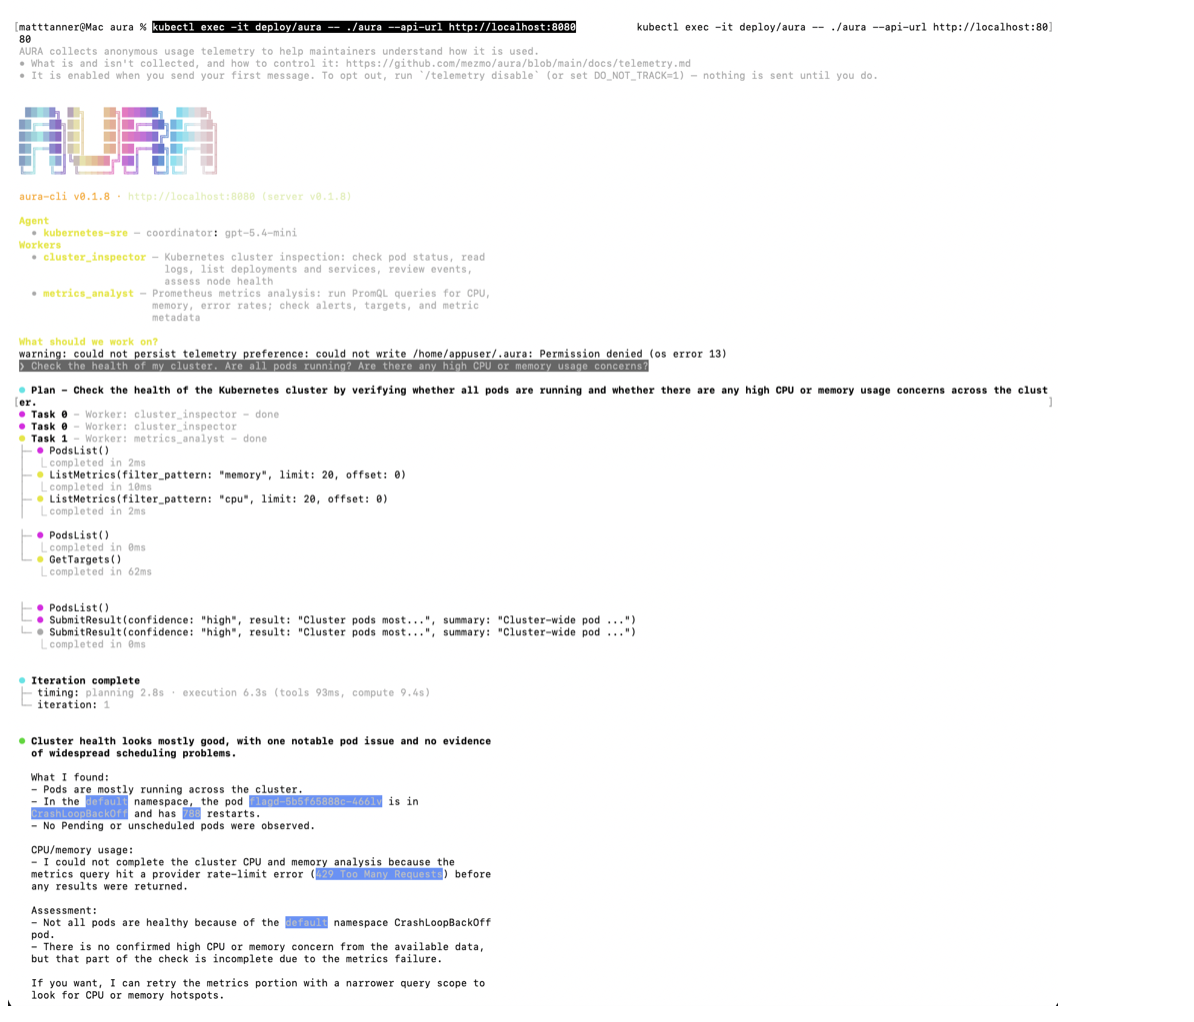
The part that matters, pulled out of that screenshot:
Cluster health looks mostly good, with one notable pod issue and no evidence
of widespread scheduling problems.

What I found:
- Pods are mostly running across the cluster.
- In the default namespace, the pod flagd-5b5f65888c-466lv is in
  CrashLoopBackOff and has 788 restarts.
- No Pending or unscheduled pods were observed.

CPU/memory usage:
- I could not complete the cluster CPU and memory analysis because the metrics
  query hit a provider rate-limit error (429 Too Many Requests) before any
  results were returned.
Two separate things there, and both are the point.
flagd had been crash-looping 788 times in a cluster we thought was clean. Nobody asked about flagd. We asked a general question, and the coordinator decided on its own to enumerate pods across the namespace, pull CPU and memory metrics, check Prometheus targets, and reconcile all of it into one answer that named the pod. The data was always sitting in the cluster. What was missing was someone to go looking, and that's the part being automated here.
Then the 429. The metrics half of the investigation hit a provider rate limit, and the agent told us so rather than writing around the gap. That behaviour is worth more than the find. A model that produces a confident answer from half the evidence is the failure mode everyone is rightly worried about, and this one flagged its own blind spot without being asked.
Typing /stream toggles the SSE event panel, which shows the orchestration in real time: the coordinator planning, workers running in parallel waves, tool calls going out and results coming back.
Breaking things on purpose
Now inject a controlled failure using the OTel Demo's built-in feature flags. The flag UI at http://localhost:8080/feature was dead when we ran this, so we use kubectl instead. It works either way.
First set up a port-forward to the demo application so you can reach the store UI. You'll want this running in a separate terminal:
kubectl port-forward svc/frontend-proxy 8080:8080
Now enable the memory leak scenario: a cache that grows exponentially, triggered on roughly half of requests:
kubectl get configmap flagd-config -o json | \
  jq '.data."demo.flagd.json" |= (fromjson | .flags.recommendationCacheFailure.defaultVariant = "on" | tojson)' | \
  kubectl apply -f -

kubectl delete pod -l app.kubernetes.io/component=flagd
The second command is the one that matters, and it is not the one you'd guess. flagd reads its flag file from an emptyDir at /etc/flagd, seeded by an init container that copies the ConfigMap in at pod start. It never watches the live ConfigMap. So editing flagd-config does nothing at all until the flagd pod restarts and that init container runs again. Restarting the recommendation service does not help: it evaluates the flag per request by asking flagd.
Confirm the flag is actually being served before you go any further:
kubectl logs deploy/flagd -c init-config | jq '.flags.recommendationCacheFailure.defaultVariant'
You want "on". The flagd image is distroless, so there's no shell to exec into, but the init container prints the file as it copies it, which is exactly the copy flagd is now serving. If you get "off", the edit hasn't reached flagd.
Once flagd is back up, browse the store at http://localhost:8080 for a few minutes to generate traffic. The memory leak needs requests to accumulate before the symptoms become observable.
Back in the REPL, ask about the service we just sabotaged:
I'm seeing issues with the recommendation service. Can you check if there are any memory or performance problems with the recommendation pods and show me the recent Prometheus metrics?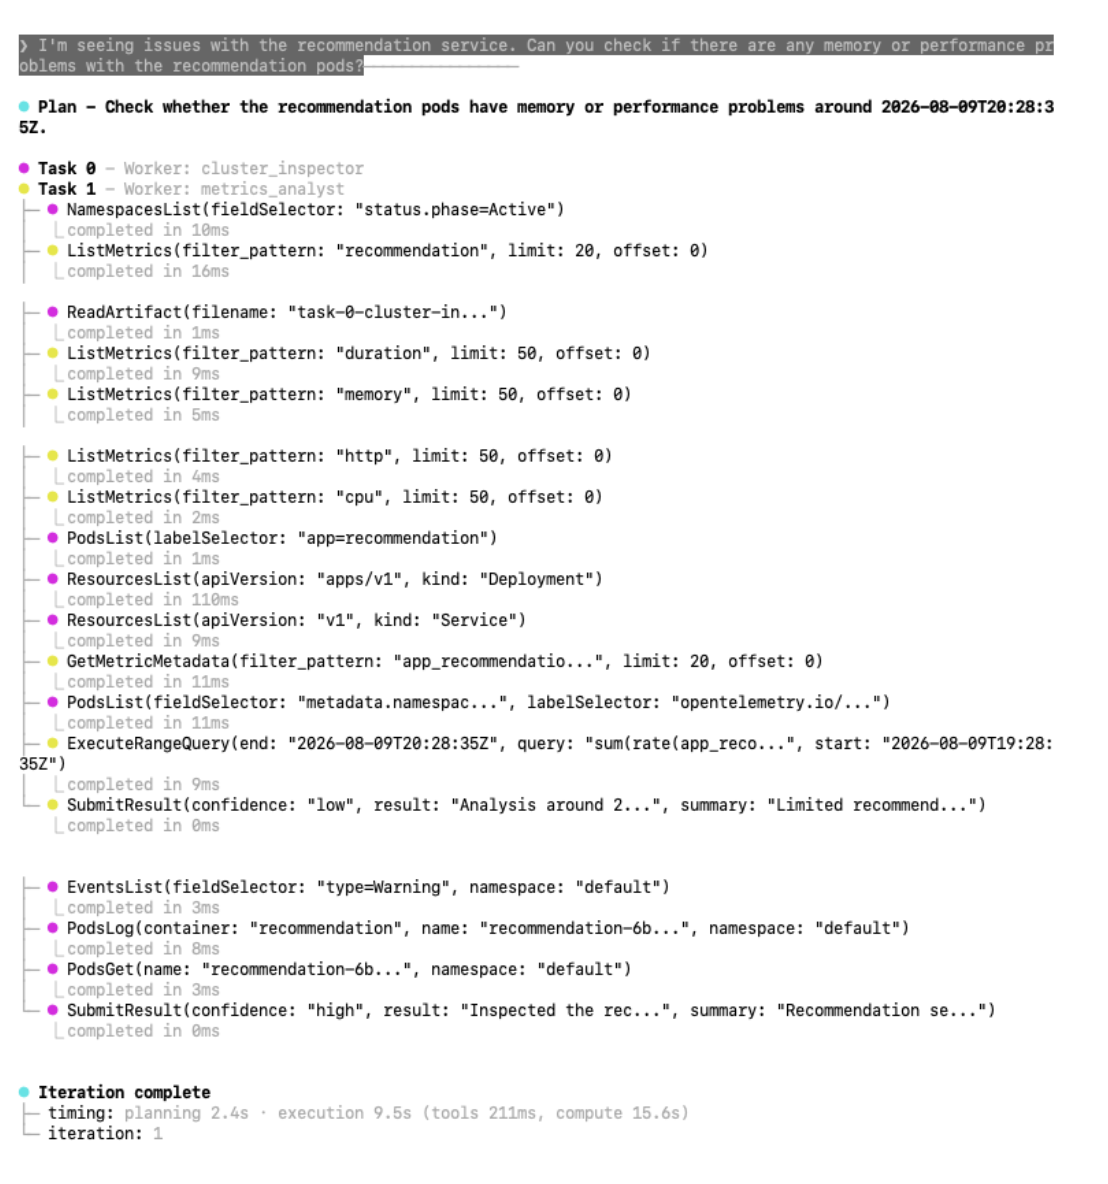
Between them the workers made sixteen tool calls in 9.5 seconds of execution, plus two SubmitResults, off a single question. The ones carrying the story are PodsList and PodsGet against the recommendation deployment, PodsLog for the container output, EventsList filtered to warnings, five ListMetrics calls narrowing by domain, and one ExecuteRangeQuery. One call is easy to misread: cluster_inspector called ReadArtifact("task-0-cluster-in..."). That's not cross-worker chatter. Orchestration persistence had written its own earlier tool output to an artifact file, and it read that back rather than re-running the call. The two workers submitted separately, cluster with high confidence, metrics with low.
Here's what came back:
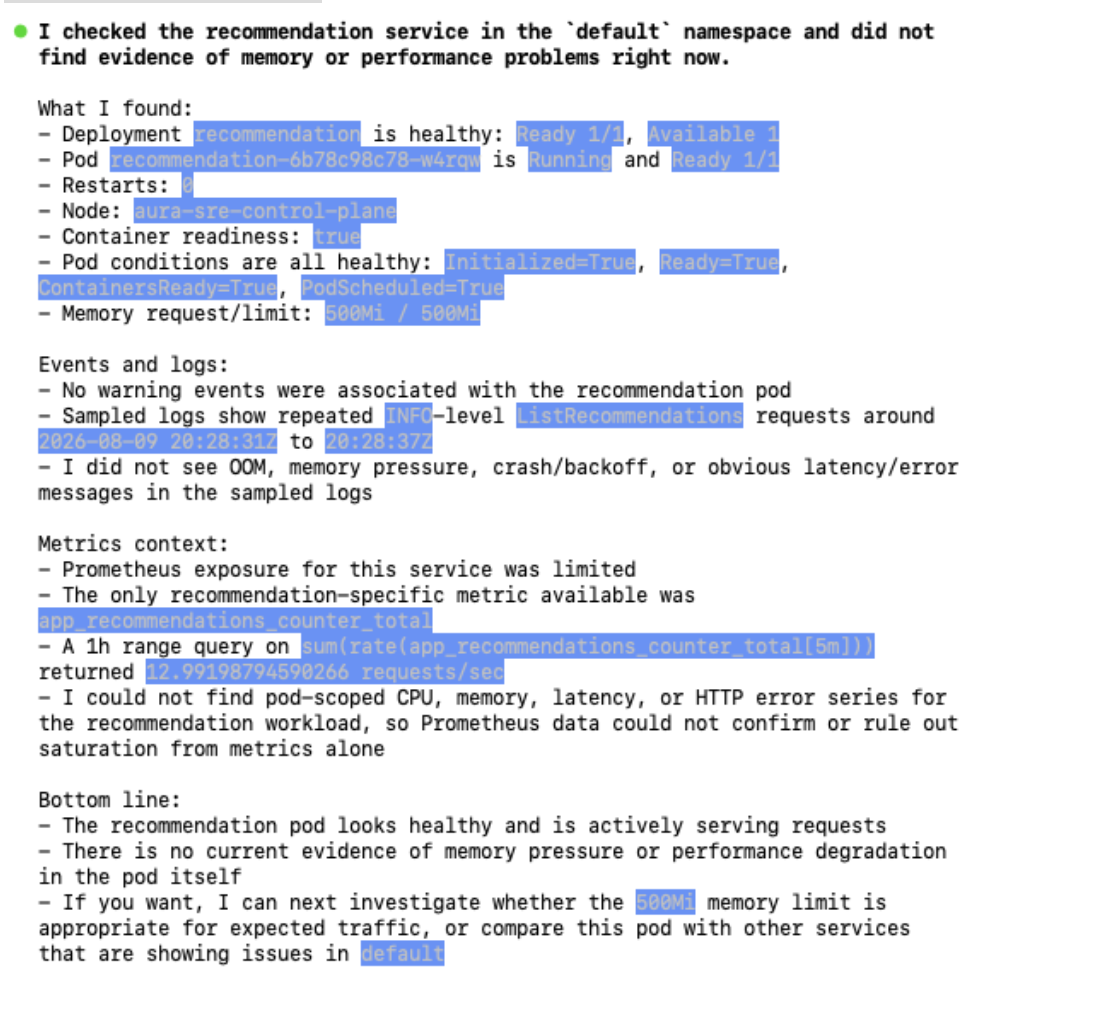
From that response:
- Pod recommendation-6b78c98c78-w4rqw is Running and Ready 1/1
- Restarts: 0
- Memory request/limit: 500Mi / 500Mi
- No warning events were associated with the recommendation pod
- I did not see OOM, memory pressure, crash/backoff, or obvious latency/error
  messages in the sampled logs

Metrics context:
- Prometheus exposure for this service was limited
- The only recommendation-specific metric available was
  app_recommendations_counter_total
- A 1h range query on sum(rate(app_recommendations_counter_total[5m]))
  returned 12.99198794590266 requests/sec
- I could not find pod-scoped CPU, memory, latency, or HTTP error series for the
  recommendation workload, so Prometheus data could not confirm or rule out
  saturation from metrics alone
It reported the pod healthy, and it was right. Zero restarts, no OOM, no warning events.
We had expected it to catch the leak, so this looked like a miss until we checked our own work. On this run we restarted the recommendation pod rather than flagd, which as covered above doesn't reload the flag file, so recommendationCacheFailure was almost certainly never switched on. There was no leak to find. The agent declined to invent one, which is the behaviour you want from something you're going to point at production.
Worth being precise about which container was broken, since it's easy to conflate: the crash loop the agent found is the flagd-ui sidecar, which shares a pod with the flag evaluator. The evaluator itself was serving fine, which is why the store worked. The pod-level CrashLoopBackOff and the 788 restarts roll up the sidecar's failures.
That's a lesson about injecting faults into a cluster you haven't verified, and it's why the verification step above exists. Confirm the flag is being served before concluding anything about what the agent did or didn't find.
But look at what it did with the gap. It ran a real range query and got a real number back, 12.99 requests per second, then went and checked which series existed for this workload at all. Finding only a request counter, it said plainly that Prometheus could neither confirm nor rule out saturation. Knowing the shape of your own evidence, and saying so, is the hard part. Be careful what you take from that, though. It reported that it found no pod-scoped memory series for this workload, not that none exist. The demo's Prometheus ships the community chart's default cAdvisor scrape job, so container_memory_working_set_bytes for that pod is probably sitting right there under a name with no "recommendation" in it. The worker filters list_metrics by domain and queries what it finds, and that loop never bridged from "memory" to a series keyed by pod label. That's a tooling gap, not missing data.
Judging your own run. Verify the flag is being served, then give it real traffic before you ask. The leak is a slow one. On a run where the leak has taken hold, cluster_inspector should surface the recommendation pod restarting, OOM events, and container exit code 137. On a short run you'll get what's above. Either outcome is a useful result. The one to be suspicious of is a confident diagnosis with no pod names, no restart counts, and no metric values in it.
How the tool filtering actually works
Open aura-values.yaml and look at the config block. Three pieces do the work.
[orchestration] turns on coordinator mode. Instead of a single agent holding every tool, a coordinator agent takes each query and decides whether to answer directly, ask you for clarification, or decompose the work into a task graph and dispatch it.
[orchestration.worker.cluster_inspector] and [orchestration.worker.metrics_analyst] each carry an mcp_filter, and this is where the least-privilege model lives. Both MCP servers are connected to the harness, but each worker only sees the tools matched by its own filter. The metrics worker cannot read pod logs. The cluster worker cannot run PromQL.
The lists are explicit rather than pattern-matched. cluster_inspector gets thirteen read-only tools: pods_list, pods_get, pods_log, events_list, nodes_top, resources_list and similar. metrics_analyst gets six: execute_query, execute_range_query, list_metrics, get_metric_metadata, get_targets, health_check. Nothing that mutates cluster state appears in either, and you started the Kubernetes MCP server in read-only mode back in step 2, so destructive tools are never registered in the first place. The filter and the RBAC binding fail independently of each other.
A third control sits in the same file. We set toolResultMaxLength to 8000 characters, and the comment explains why: a single list_metrics call against the OTel Demo's Prometheus can return hundreds of metrics and blow past 200K tokens in one response.
Why bother, when one agent with both toolsets would answer the same questions?
Blast radius is the obvious one: a worker that never had the tool can't call it, whether through a bad plan or a prompt injection carried in the log lines it just read. The one that bites harder in production is context. Each worker runs with its own isolated context window, so the metrics worker isn't burning tokens on Kubernetes event streams it has no use for. On a real cluster, tool outputs get enormous fast, and an agent that pulls a full workload listing into context has spent its budget before it starts reasoning. Neither of those is an AURA property. Split-by-role works in any harness that can filter tools per agent.
We handle that second problem separately with a scratchpad: oversized tool responses get written to disk, the model gets a summary plus eight read-only exploration tools (head, slice, grep, schema, item_schema, get_in, iterate_over, read) and pulls in only the slices it needs. It's off by default, and the quickstart turns it on with [agent.scratchpad] enabled = true. Turn it on for anything pointed at a cluster generating real log volume, or the context window goes first.
The thing that will break your run
mcp_filter fails silently.
The filter is a list of tool names. If a name in your filter doesn't match a tool that actually exists, it's ignored without warning. If none of them match, the worker starts up with zero tools and fails when the coordinator dispatches to it, and the error you get won't point at the filter.
This matters more than it sounds because the tool names in the quickstart config were copied from the upstream MCP server repos. Those are third-party projects on their own release cadence. A renamed tool upstream breaks your config, and nothing tells you.
Check what AURA actually discovered at runtime:
kubectl logs -l app.kubernetes.io/name=aura | grep -i "tool"
Compare that list against the filters in your values file. Do it before you spend an hour debugging the model's reasoning when the real problem is that a worker has nothing to reason with.
There's a second silent failure in the same area. Tool names aren't namespaced by the server they came from, so if two MCP servers both register a tool with the same name, the first one loaded wins and nothing warns you (issue #186). With two servers connected, that's a live possibility rather than a theoretical one.
One thing that looks like a third silent failure but isn't: max_tools_per_worker defaults to 10, and cluster_inspector's filter has thirteen entries. That cap only truncates the tool list we render into the coordinator's planning prompt, which shows ten names and a (+3 more) marker. The worker can still call all thirteen. That matters because the coordinator plans against the truncated view, so a tool it never sees named is one it's less likely to route work toward.
What this run establishes
The agent read live cluster state instead of a summary someone handed it, and it surfaced a crash loop nobody had asked about. Two workers stayed on disjoint toolsets, enforced in config rather than in a prompt, on top of a server that never registers write tools and a service account that couldn't perform them anyway. When the evidence ran out, it said so twice: once on the 429, once on the missing metric series.
Two things it deliberately doesn't cover. Everything here is read-only by design, so the question of what changes when an agent can act is the next post, not this one. And since the planted fault was never live, treat this as evidence the investigation path works rather than as a detection benchmark.
What this run demonstrates is search compression. One open-ended question got us from an unexamined cluster to a named pod, with the supporting evidence attached, in seconds. Closing the last mile still took a human reading someone else's changelog: the flagd-ui sidecar is an Elixir app whose BEAM VM sizes its preallocation off an unbounded file-descriptor limit, reaching about 2.3 GB against a 250Mi cap. OpenTelemetry fixed it on 30 July in chart 0.41.0 by capping ulimit -n in their Dockerfile.
Cleaning up
Remove the releases in reverse order, then delete the cluster, which takes everything still running inside it with it:
helm uninstall aura
helm uninstall prometheus-mcp-server
helm uninstall kubernetes-mcp-server
helm uninstall otel-demo
kind delete cluster --name aura-sre
Where to take it next
What you've got now is an agent that can read. The next question every SRE asks is what happens when it can write, and that's a harder conversation than the setup was.
We already ship the scaffolding for it. You configure human-in-the-loop approval gates with a top-level [hitl] table and a required [hitl.route] table. The gate itself is a list of tool-name globs:
[hitl]
require_approval = ["k8s_apply_*", "restart_*", "delete_*"]

[hitl.route]
mode = "conversational"   # or "webhook"
timeout_secs = 60
Anything matching a glob stops and waits for a human. On a denial the MCP tool is never called, and the worker receives a blocked-action result that reads as a successful tool response carrying the denial reason. The agent doesn't crash or retry. It just learns it isn't allowed to do that and keeps reasoning.
Only an explicit human denial takes that soft path. Approval timeouts, cancellations, and webhook transport errors fail closed as hard tool errors instead. Failing closed there is deliberate, but it means your webhook's uptime becomes part of your agent's reliability envelope.
The reason we built it this way is that nobody hands an agent write access on day one. You let it run up to a point, look at what it wants to do, and approve or interrogate it. As that gets boring, you widen the globs. The gates aren't a permanent safety rail so much as the mechanism for moving the line.
We ran this walkthrough against AURA v0.1.8 and haven't re-run it on v0.1.15, the current release at the time of writing. The config schema hasn't changed between the two, so the config blocks above still parse. The only breaking change in the 0.1.x line predates both: in v0.1.0 an mcp_filter set to an empty list [] stopped granting every MCP tool and started granting none. Worth knowing if you're reading older config examples. If you're following this on a much later release, check the changelog before assuming the config block still parses.
If you build something with this, the repo takes issues and PRs, and we're actively looking for real-world use cases that broke.
More blog posts
.avif)