Control Your Logging Spend With Usage Quotas

4 MIN READ
MIN READ

We built Mezmo, formerly known as LogDNA, around the idea that developers are more productive when they have access to all of the logs they need, when they need them. However, we also know that log management can get expensive fast. And, for anyone who owns the budget for developer tools, logs can be an unpredictable line item as you try to determine your monthly, quarterly or even annual spend. For instance, one usage spike in your application, whether it’s from unforeseen circumstances or a developer forgetting to turn debug off, can result in a surprise logging bill of 10x more than you originally budgeted!

That’s why we are happy to announce the launch of Usage Quotas, our newest feature that is now available for all Mezmo enterprise customers. This new functionality empowers account admins with the ability to more explicitly control the amount of log data their teams are ingesting, creating more predictable monthly and annual spend to avoid those surprise overage bills.

Usage Quotas give you the flexibility to control your log retention with a hard quota or a soft quota. We’ll dive into the benefits of each below.

Setting a Hard Quota 

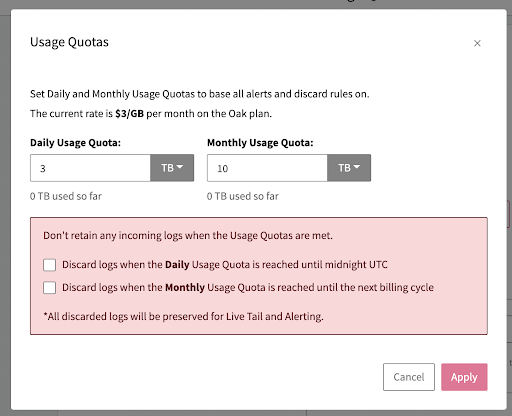
At its most basic level, Usage Quotas let you set a daily or monthly hard limit on the volume of logs stored in Mezmo. As you approach your daily or monthly limit, you can specify a threshold at which to stop retaining logs. After that threshold is hit, any logs that pass through the system will still be displayed in Live Tail and will trigger any relevant Alerts, but will not be stored and cannot be found in Search. And most importantly, any logs ingested after the quota is met will not be counted toward your monthly usage bill -  no more surprise overages!

LogDNA-Feature-usage-quotas
From your Mezmo account, you can easily set thresholds for the volume of logs being ingested, and protect against unforeseen overage costs.

LogDNA-Feature-Usage-Quotas-Daily-Monthly-Quotas
You can set a daily or monthly quota, or even both. Note that all logs that enter Mezmo after the quota is hit will be discarded for the remainder of the day/billing cycle, but will still show in Live Tail and trigger Alerts.


Setting a Soft Quota 

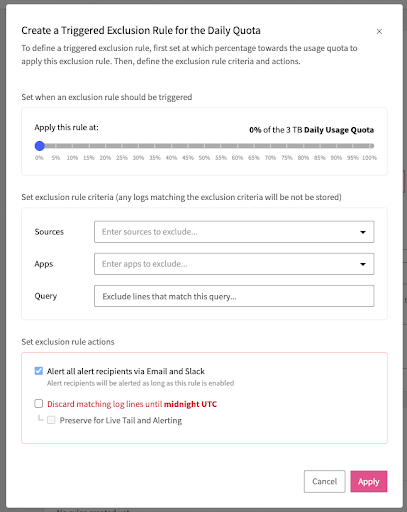
Setting a hard daily or monthly quota should keep costs under control, but we also know that there are certain logs that are mission critical. Your teams need access to data from the sources that matter most, such as emergency and critical Alerts as opposed to notification or informational Alerts. Along with cost control, admins also need the flexibility to keep high value data flowing, which is why we also included the ability to set up soft quotas. This quota type ensures that you aren’t discarding 100% of incoming logs if a quota has been reached. Instead, this allows you to implement predefined Exclusion Rules and throttle the amount of logs being retained as you approach the hard threshold, and even allows you to go over if the data is considered mission critical. This will allow teams to aim for a daily or monthly quota, while still allowing the flexibility to go over that limit in a controlled manner. You can configure this by setting a high-level daily or monthly quota without checking ‘Discard logs when the Daily/Monthly Usage Quota is reached’ check boxes. 

Soft quotas create an added level of flexibility, and allow you to ensure critical log data is prioritized as you approach usage thresholds. You can set soft quotas to match your daily or monthly hard quotas.

Real-Time Alerts on Usage

For both hard and soft quotas, Mezmo requires that you set up notification rules to ensure that the appropriate team members are aware when you hit hard quotas, or when exclusion rules are triggered through soft quotas. This is set up within the Usage Quotas menu item in your Mezmo account (Settings>Usage>Usage Quotas), and includes integrations with email and Slack. 


Try Usage Quotas Today

The Usage Quotas quotas feature is available for all Mezmo enterprise customers, and is restricted to Owner and Admin user roles only. To learn more about how to use this feature, check out our documentation

I’m excited to bring you more features to help manage spend on Mezmo.


Table of Contents

    Share Article

    RSS Feed

    Next blog post
    You're viewing our latest blog post.
    Previous blog post
    You're viewing our oldest blog post.
    Mezmo + Catchpoint deliver observability SREs can rely on
    Mezmo’s AI-powered Site Reliability Engineering (SRE) agent for Root Cause Analysis (RCA)
    What is Active Telemetry
    Launching an agentic SRE for root cause analysis
    Paving the way for a new era: Mezmo's Active Telemetry
    The Answer to SRE Agent Failures: Context Engineering
    Empowering an MCP server with a telemetry pipeline
    The Debugging Bottleneck: A Manual Log-Sifting Expedition
    The Smartest Member of Your Developer Ecosystem: Introducing the Mezmo MCP Server
    Your New AI Assistant for a Smarter Workflow
    The Observability Problem Isn't Data Volume Anymore—It's Context
    Beyond the Pipeline: Data Isn't Oil, It's Power.
    The Platform Engineer's Playbook: Mastering OpenTelemetry & Compliance with Mezmo and Dynatrace
    From Alert to Answer in Seconds: Accelerating Incident Response in Dynatrace
    Taming Your Dynatrace Bill: How to Cut Observability Costs, Not Visibility
    Architecting for Value: A Playbook for Sustainable Observability
    How to Cut Observability Costs with Synthetic Monitoring and Responsive Pipelines
    Unlock Deeper Insights: Introducing GitLab Event Integration with Mezmo
    Introducing the New Mezmo Product Homepage
    The Inconvenient Truth About AI Ethics in Observability
    Observability's Moneyball Moment: How AI Is Changing the Game (Not Ending It)
    Do you Grok It?
    Top Five Reasons Telemetry Pipelines Should Be on Every Engineer’s Radar
    Is It a Cup or a Pot? Helping You Pinpoint the Problem—and Sleep Through the Night
    Smarter Telemetry Pipelines: The Key to Cutting Datadog Costs and Observability Chaos
    Why Datadog Falls Short for Log Management and What to Do Instead
    Telemetry for Modern Apps: Reducing MTTR with Smarter Signals
    Transforming Observability: Simpler, Smarter, and More Affordable Data Control
    Datadog: The Good, The Bad, The Costly
    Mezmo Recognized with 25 G2 Awards for Spring 2025
    Reducing Telemetry Toil with Rapid Pipelining
    Cut Costs, Not Insights:   A Practical Guide to Telemetry Data Optimization
    Webinar Recap: Telemetry Pipeline 101
    Petabyte Scale, Gigabyte Costs: Mezmo’s Evolution from ElasticSearch to Quickwit
    2024 Recap - Highlights of Mezmo’s product enhancements
    My Favorite Observability and DevOps Articles of 2024
    AWS re:Invent ‘24: Generative AI Observability, Platform Engineering, and 99.9995% Availability
    From Gartner IOCS 2024 Conference: AI, Observability Data, and Telemetry Pipelines
    Our team’s learnings from Kubecon: Use Exemplars, Configuring OTel, and OTTL cookbook
    How Mezmo Uses a Telemetry Pipeline to Handle Metrics, Part II
    Webinar Recap: 2024 DORA Report: Accelerate State of DevOps
    Kubecon ‘24 recap: Patent Trolls, OTel Lessons at Scale, and Principle Platform Abstractions
    Announcing Mezmo Flow: Build a Telemetry Pipeline in 15 minutes
    Key Takeaways from the 2024 DORA Report
    Webinar Recap | Telemetry Data Management: Tales from the Trenches
    What are SLOs/SLIs/SLAs?
    Webinar Recap | Next Gen Log Management: Maximize Log Value with Telemetry Pipelines
    Creating In-Stream Alerts for Telemetry Data
    Creating Re-Usable Components for Telemetry Pipelines
    Optimizing Data for Service Management Objective Monitoring
    More Value From Your Logs: Next Generation Log Management from Mezmo
    A Day in the Life of a Mezmo SRE
    Webinar Recap: Applying a Data Engineering Approach to Telemetry Data
    Dogfooding at Mezmo: How we used telemetry pipeline to reduce data volume
    Unlocking Business Insights with Telemetry Pipelines
    Why Your Telemetry (Observability) Pipelines Need to be Responsive
    How Data Profiling Can Reduce Burnout
    Data Optimization Technique: Route Data to Specialized Processing Chains
    Data Privacy Takeaways from Gartner Security & Risk Summit
    Mastering Telemetry Pipelines: Driving Compliance and Data Optimization
    A Recap of Gartner Security and Risk Summit: GenAI, Augmented Cybersecurity, Burnout
    Why Telemetry Pipelines Should Be A Part Of Your Compliance Strategy
    Pipeline Module: Event to Metric
    Telemetry Data Compliance Module
    OpenTelemetry: The Key To Unified Telemetry Data
    Data optimization technique: convert events to metrics
    What’s New With Mezmo: In-stream Alerting
    How Mezmo Used Telemetry Pipeline to Handle Metrics
    Webinar Recap: Mastering Telemetry Pipelines - A DevOps Lifecycle Approach to Data Management
    Open-source Telemetry Pipelines: An Overview
    SRECon Recap: Product Reliability, Burn Out, and more
    Webinar Recap: How to Manage Telemetry Data with Confidence
    Webinar Recap: Myths and Realities in Telemetry Data Handling
    Using Vector to Build a Telemetry Pipeline Solution
    Managing Telemetry Data Overflow in Kubernetes with Resource Quotas and Limits
    How To Optimize Telemetry Pipelines For Better Observability and Security
    Gartner IOCS Conference Recap: Monitoring and Observing Environments with Telemetry Pipelines
    AWS re:Invent 2023 highlights: Observability at Stripe, Capital One, and McDonald’s
    Webinar Recap: Best Practices for Observability Pipelines
    Introducing Responsive Pipelines from Mezmo
    My First KubeCon - Tales of the K8’s community, DE&I, sustainability, and OTel
    Modernize Telemetry Pipeline Management with Mezmo Pipeline as Code
    How To Profile and Optimize Telemetry Data: A Deep Dive
    Kubernetes Telemetry Data Optimization in Five Steps with Mezmo
    Introducing Mezmo Edge: A Secure Approach To Telemetry Data
    Understand Kubernetes Telemetry Data Immediately With Mezmo’s Welcome Pipeline
    Unearthing Gold: Deriving Metrics from Logs with Mezmo Telemetry Pipeline
    Webinar Recap: The Single Pane of Glass Myth
    Empower Observability Engineers: Enhance Engineering With Mezmo
    Webinar Recap: How to Get More Out of Your Log Data
    Unraveling the Log Data Explosion: New Market Research Shows Trends and Challenges
    Webinar Recap: Unlocking the Full Value of Telemetry Data
    Data-Driven Decision Making: Leveraging Metrics and Logs-to-Metrics Processors
    How To Configure The Mezmo Telemetry Pipeline
    Supercharge Elasticsearch Observability With Telemetry Pipelines
    Enhancing Grafana Observability With Telemetry Pipelines
    Optimizing Your Splunk Experience with Telemetry Pipelines
    Webinar Recap: Unlocking Business Performance with Telemetry Data
    Enhancing Datadog Observability with Telemetry Pipelines
    Transforming Your Data With Telemetry Pipelines