LogDNA Guide: Putting Alerts into Practice
Alerts are a core part of monitoring systems. Using alerts keeps you aware of changes within your infrastructure and applications, helping you identify and respond to issues faster. Log management solutions like Mezmo provide an ideal environment for configuring alerts, since it allows you to create detailed alerts based on your log data. Rather than manually search for problems, you can use alerts to scan your log data in real-time monitoring mode and receive immediate notifications on potential problems.
1. Monitoring System Activity
Log volume is a strong indicator of how active your systems and applications are. A sudden increase or decrease in overall log volume could indicate several things, including:
- Surges in user-driven traffic to your website or web application
- Surges in illegitimate traffic (e.g. a DDoS attack)
- Problems with one or more components, resulting in spikes in error logs
- Changes to your infrastructure or application (such as adding a new node to a cluster or scaling a Kubernetes Deployment)
While log volume will vary on a minute-by-minute basis, tracking your logs over a long period of time will help you create a baseline for comparison. LogDNA includes a powerful graphing feature that we can use to identify this baseline. For example, the following graph shows our total log volume over a 3 day period. Mousing over a point on the graph shows us the number of events recorded for that particular hour. Here we record an average of 2,700–2,800 events per hour. Note that the sudden drop at the end is the result of taking this screenshot shortly after 10am, and not any problem with our systems:
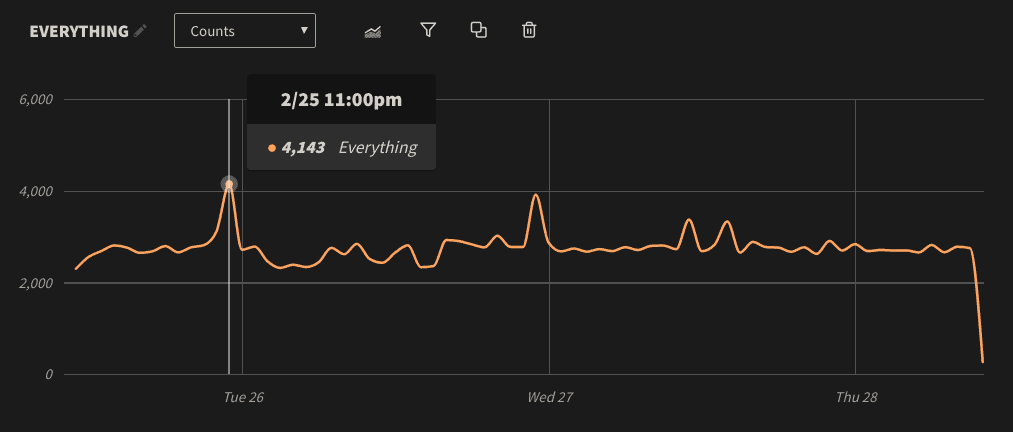
We can also see some pretty obvious deviations as indicated by the peaks. In one case, our log volume surged to 1.5X its normal value. If we click on this point and select Show Logs, we can jump directly to the events in the log timeline. As it turns out, one of our Kubernetes Pods was stuck in a constant loop of attempting to start, crashing, and restarting.
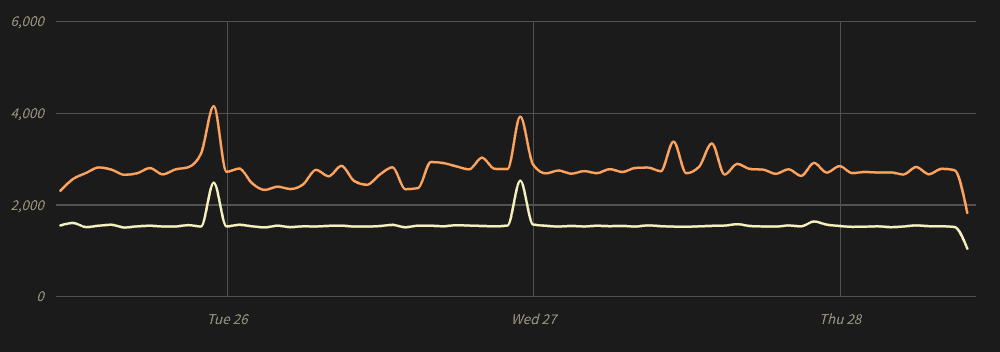
While Kubernetes logs only account for half of our total log volume, they are the direct cause the two biggest surges in the chart (as indicated by the yellow line):
Once the problem was addressed, our log volume immediately returned to normal.
Use Presence Alerts to Detect Surges
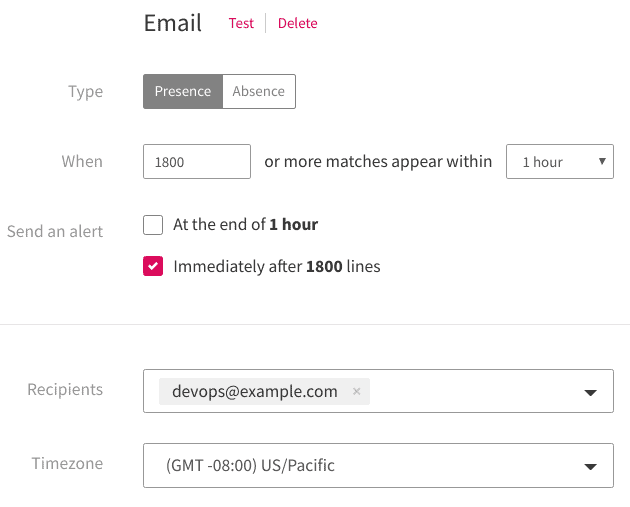
To monitor for future problems like this, we can create a view that only displays Kubernetes events. The chart shows an average of roughly 1,500 events per hour. With this in mind, we can then add a view-specific alert that notifies us if the number of events exceeds (for example) 1,800 events in one hour. As soon as we pass that threshold, LogDNA sends an alert to our DevOps team:
Use Absence Alerting to Detect Downtime
When monitoring for problems, the common approach is to look for increases in log volume. However, a decrease in log volume could indicate a bigger problem, such as:
- Decreasing traffic to your applications
- Hardware or software failures
- Networking problems between your systems and your log management solution
- Problems with the log management solution itself
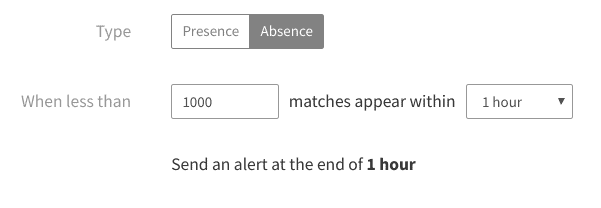
With absence alerts, we can send a notification if volume drops below a certain threshold. Using our Kubernetes example, we can create an alert that notifies the team if we get fewer than 1,000 logs in an hour. If we want to reduce the risk of false positives (alerts triggered by natural changes in volume, rather than actual problems), we can reduce this number even further:
2. Detecting Security Events
Software security is a constantly moving target, with attackers always searching for new ways to break into and exploit applications. Logging security incidents provide a significant number of benefits, including:
- Creating an audit trail of incidents
- Recording important contextual data such as the origin of the attack (e.g. IP addresses) and affected component(s)
- Reporting incidents in near real-time
Alerting on security events lets you keep track of potential incidents so you can respond to and protect against threats more quickly.
For example, a common security event on any public-facing server is SSH probing. In an SSH probe, an attacker repeatedly tries to log into SSH using a variety of username and password combinations. Since SSH is the default administration tool for Linux servers, attackers use a variety of automated scripts to detect and attack public SSH servers.
For example, these logs record an attempt from 192.168.105.294 to log in as a user named bw:Feb 27 18:51:44 sshd[337]: Invalid user bw from 192.168.105.294 port 45012
Feb 27 18:51:44 sshd[337]: Disconnected from invalid user bw 192.168.105.294 port 45012 [preauth]
Feb 27 18:51:44 sshd[337]: Received disconnect from 192.168.105.294 port 45012:11: Bye Bye [preauth]
SSH probes are a frequent occurrence, and alerting on each one would quickly lead to alarm fatigue. But what if one of these attacks was successful? Let's say there actually is a bw user on the server, and the attacker happened to guess the right password. In that case, we would see this message appear in our logs:
pam_unix(sshd:session): session opened for user bw by (uid=0)
We could alert on all successful SSH logins, but that could also lead to alarm fatigue. Instead, we can create an alert only alerts on successful logins that don't belong to a predetermined set of users.
For example, let's say we have a server with a single administrator named logdna. We can view all SSH events caused by logdna by using the search program:sshd logdna:

Here we see a failed login followed by a successful login. The first and third logs show the authentication method (password), while the second and fourth logs show the result of the authentication attempt (failed and successful, respectively). Given that logdna is the only user with access, we can search for unauthorized logins using program:sshd "session opened for user" -logdna. This searches for all successful authentications where the user is not the logdna user. We'll save this as a new view, then create an alert based on that view.

Now, if any user other than logdna successfully logs in via SSH, the team will immediately receive a notification.
3. Billing Notifications
Besides tracking changes in demand, monitoring log volume plays another important role: estimating costs. This is particularly important when using SaaS-based log management solutions, where your costs are often directly related to log volume. You can view your total usage by opening the LogDNA web app and Settings and Usage. You can learn more about our enhancements to usage dashboard by reading this blog post.

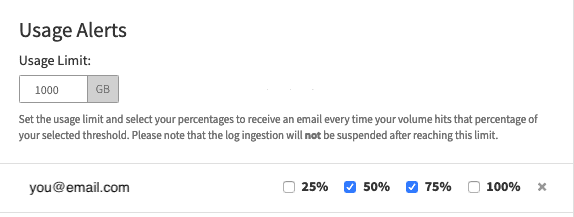
You can also create an alert if your usage exceeds a certain amount. While in the LogDNA web app, navigate to Settings, Usage, and then Usage Alerts. Here, you can choose to email an alert after logging the amount specified (in GB). You should also choose to be notified when various thresholds are reached in such as 25%, 50%, 75% and 100% —so that you have enough time to create filters or suspend logging before reaching your budget.
Alternatively, if you know the average size of your events, you can calculate the approximate maximum number of events that you can ingest over a 24 hour period. For example, let's say our logs average 200 bytes per event, and we want to be notified when we exceed 30 GB in a given month. That gives us a maximum of 150 million events per month, which equates to 5 million events per day, 208,333 events per hour, and 3,472 events per minute. Creating an alert with these limits can automatically and immediately notify you of a potential overage long before you approach your limit.
Conclusion
LogDNA Alerts is a powerful yet often underutilized part of log management. Using alerts effectively can help keep you and your team aware of your infrastructure's operational performance, potential problems, security incidents, and more. With LogDNA, you have the ability to create an unlimited number of alerts with thresholds as low as 30 seconds. Integrate your alerts with multiple different channels including email, Slack, Pagerduty, and Datadog. To get started, sign up for a free trial account.
Table of Contents
Share Article


RSS Feed

Similar blog posts
.png)