
Troubleshoot faster, right from your IDE
Extend the power of telemetry pipeline to your favorite development environment. Use natural language to query and analyze your telemetry data without ever leaving your workflow. See it in action with a free trial of Mezmo.
Mezmo MCP server
Go from a case ID to a full event trace with a single natural language query. Eliminate the manual work of filtering logs and accelerate your time to resolution.
Avoid interrupting your coding flow. The Mezmo MCP server brings the data to you, allowing you to debug issues without ever leaving your IDE.
Don't just get raw logs - get a summary. The agent can perform root cause analysis and identify problematic code, providing actionable insights instantly.
- Enrich, reduce, and transform telemetry at the source
- Eliminate noisy logs, redundant traces, and expensive metric sprawl
- Feed clean, contextual data to observability stacks and AI systems
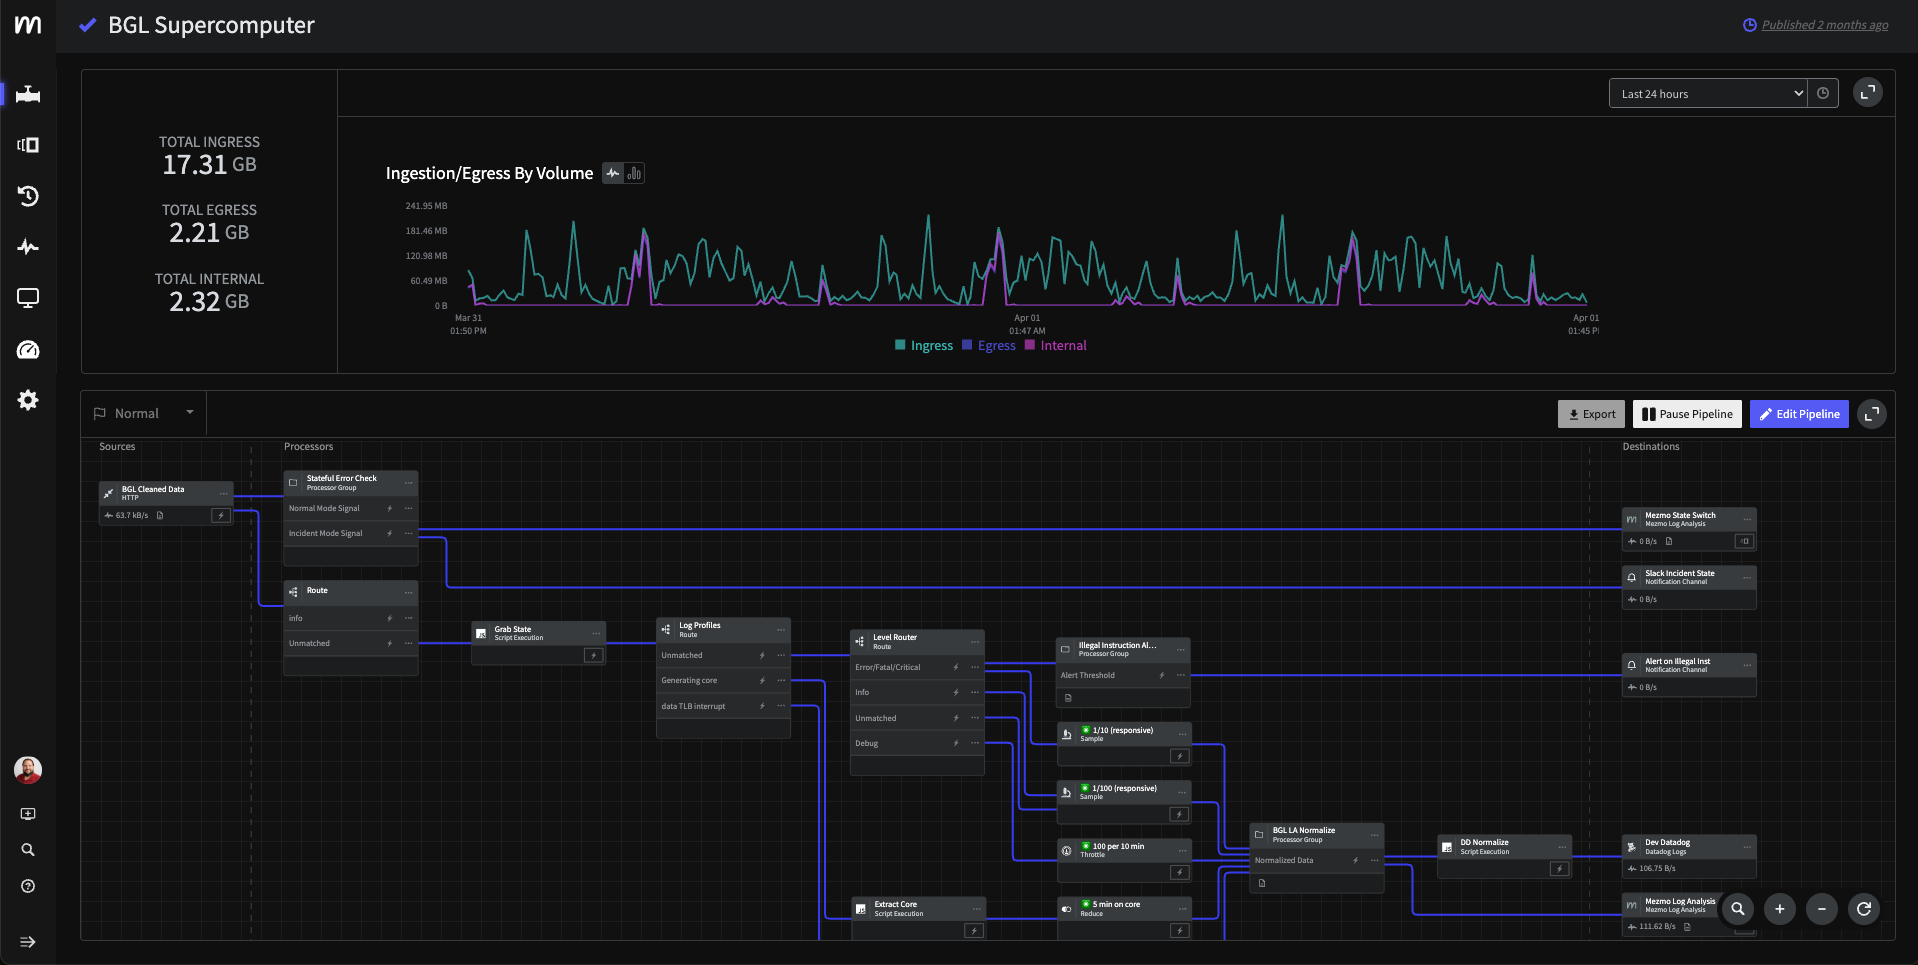
Transform your observability strategy
Key capabilities for Telemetry Pipeline
Stream telemetry data in real-time and replay buffered events for instant incident investigation without waiting for indexing or storage delays.
Make intelligent sampling decisions after seeing complete trace spans, ensuring critical errors and anomalies are always captured while dropping routine traffic.
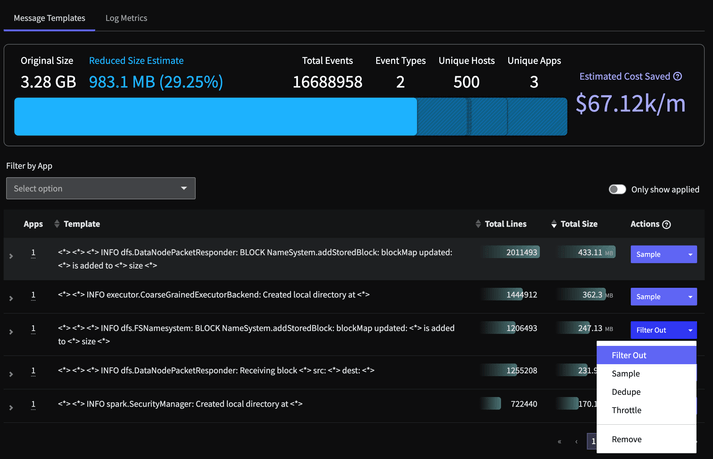
Continuously analyze telemetry patterns to identify high-volume, low-value data streams and provide actionable recommendations for cost optimization.
Define, version, and deploy telemetry pipelines using declarative configuration files integrated with your existing CI/CD workflows and infrastructure-as-code practices.
Automatically adapt pipeline behavior based on real-time conditions, scaling processing capacity and adjusting sampling rates to maintain performance during traffic spikes.
Enhance telemetry data with contextual metadata from external sources, standardize formats, and add business context to improve observability and enable better analysis.
Monitor and control metric cardinality in real-time to prevent exponential cost increases from high-cardinality tags while preserving essential dimensional data.
Transform thousands of custom metrics into high-value aggregates (p95, p99, averages) to slash observability costs while improving signal quality downstream.
Real-world use cases for Telemetry Pipeline
Challenge
Datadog costs growing 300% year-over-year with limited visibility into spending
Solution
Implemented Mezmo pipelines to filter and aggregate logs before Datadog ingestion
Results
✔️ 52% reduction in Datadog costs
✔️ 40% faster incident resolution
✔️ 90% reduction in noisy alerts
Challenge
Overwhelming telemetry data volume from network infrastructure
Solution
Implemented Mezmo pipelines to filter and aggregate logs before Used Mezmo to filter and parse data, indexing only necessary fields
Results
✔️ 50% reduction in overall telemetry data
✔️ Eliminated redundant data storage
✔️ Improved query performance by 3x
Explore more
Get control of your telemetry
- ✔ Schedule a 30-minute session
- ✔ No commitment required
- ✔ Free trial available
