
LogDNA is now Mezmo but the product you know and love is here to stay.

Modern web applications are more reliant on the frontend than ever before. While there are many benefits to this approach, one downside is that developers can lose visibility into issues when things go wrong. When the application experience is degraded, engineers are left waiting for users to report issues and share browser logs. Otherwise, they might be left in the dark and unaware that any issues exist in the first place. With more complex code running on the browser side, it is critical that developers have real-time access to front end logs in order to fully understand the state of their applications.
The Mezmo platform fits seamlessly into your telemetry pipeline, helping DevOps and SecOps teams centralize log data—from both frontend and backend sources—for improved troubleshooting and compliance insights. This is why we are excited to introduce new functionality for capturing frontend log data with our Browser Logger feature. Frontend developers can easily ingest browser logs, collect the diagnostic data that they need to understand when and why the user experience is degraded, and view browser data in context with other services (both on the client and server side).
By integrating frontend log visibility with backend metrics and server-side security logs, Mezmo supports a truly full stack monitoring approach that empowers rapid root cause analysis.
Enrich Log Lines with Client Metadata
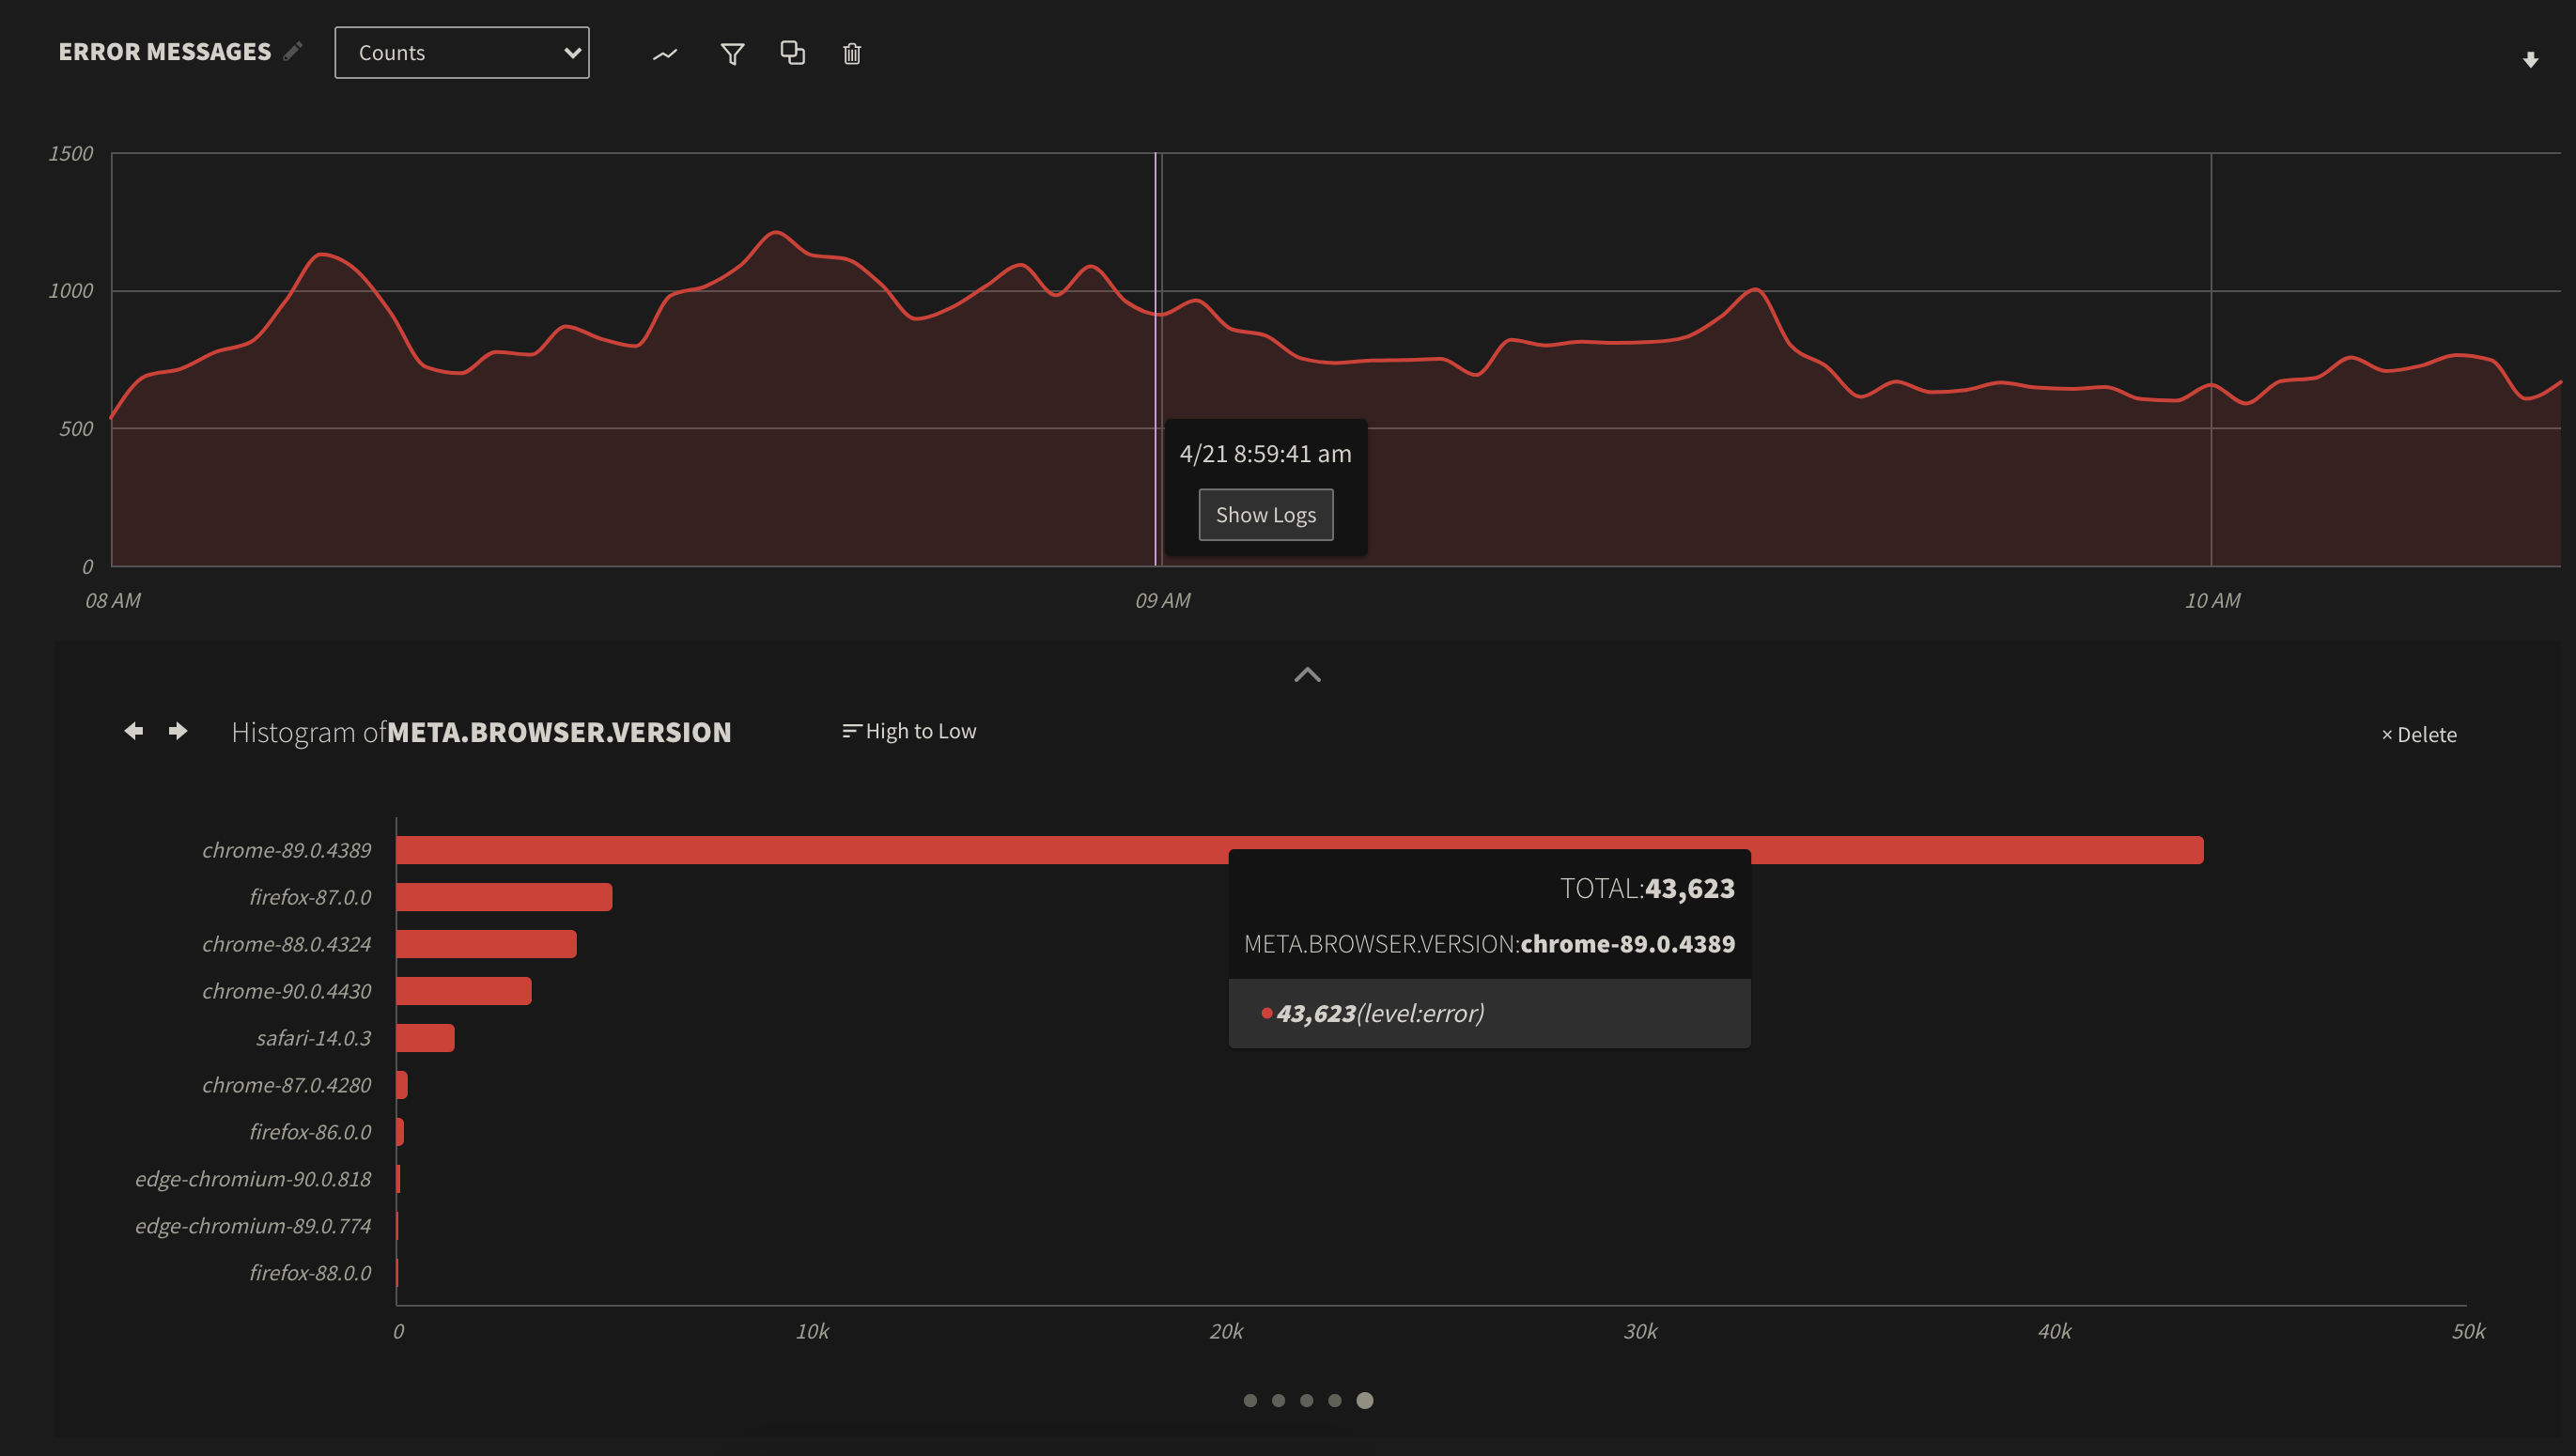
Out of the box, Browser Logger automatically captures data such as browser version, OS, URL, and more with errors and events sent to LogDNA. This means you can easily narrow down error patterns that might be occurring on a specific part of your site, or only happening on certain versions of a given browser, helping teams pinpoint and reproduce issues quicker.
Additionally, you can attach application-specific metadata to each log line such as username, session replay URL and more to be able to link out to your other debugging tools or trace a request from frontend to backend. This cross-context data is particularly useful for SIEM tools, which can correlate frontend behavior with broader security events.
No Data Left Behind
By default, Browser Logger automatically captures any uncaught exceptions or console.log messages. Even if your application throws an error that you didn't anticipate, the error would automatically be forwarded to LogDNA for your team to be alerted on. That way your engineering team won't be blind to unexpected errors ruining your customer's experience with your application.
Additionally any logs outputted via console.log that might help debug an issue are automatically captured by Browser Logger. This means if you have existing debug logs being tracked via console.log, Browser Logger will pick up on them automatically. There's no need to re-instrument or add vendor-specific logging statements everywhere in your app.
Add Mezmo Without Sacrificing Performance
Optimized for browser environments, we make sure the Mezmo Browser Logger adds minimal overhead to your application's load time. At only 8kb gzipped, it complements your existing observability and telemetry tooling with one of the lightest footprints for real-time logging.
Quickly Scale Best Practices
With the Browser Logger Template, you can use out-of-the-box Views, Boards and Screens to kick-start your observability into frontend logs. View aggregated error messages, or see which browser version is likely affected by a given error. Additionally, you can set up alerts to be triggered whenever your application is reporting more errors than expected.
To get started with Browser Logger and enhance your full stack monitoring strategy, check out our documentation.
More blog posts


