
Logs are like gold ore. They have valuable nuggets of information, but those nuggets often come in a matrix of less helpful material. Extracting the gold from the ore is crucial because it is vital to unlocking insights and optimizing your system(s). Raw logs can be overwhelming, containing informational messages, debug statements, errors, etc. However, buried within this sea of data lies the key metrics you can use to understand your applications' performance, availability, and health.
Without the ability to separate and extract metrics from your logs, you're left with a mountain of unstructured data, making it challenging to derive meaningful insights. It's like manually searching through an entire gold mine, sifting through tons of rocks and debris to find the valuable nuggets—an arduous, resource-intensive, and inefficient process.
With Mezmo Telemetry Pipeline as our refining tool, we’ll show you how to extract, transform, and categorize the metrics hidden within your logs. By separating the valuable metrics from the noise, you’ll gain the clarity and focus needed to make data-driven decisions and take proactive measures to ensure optimal system performance.
Striking Gold With Mezmo
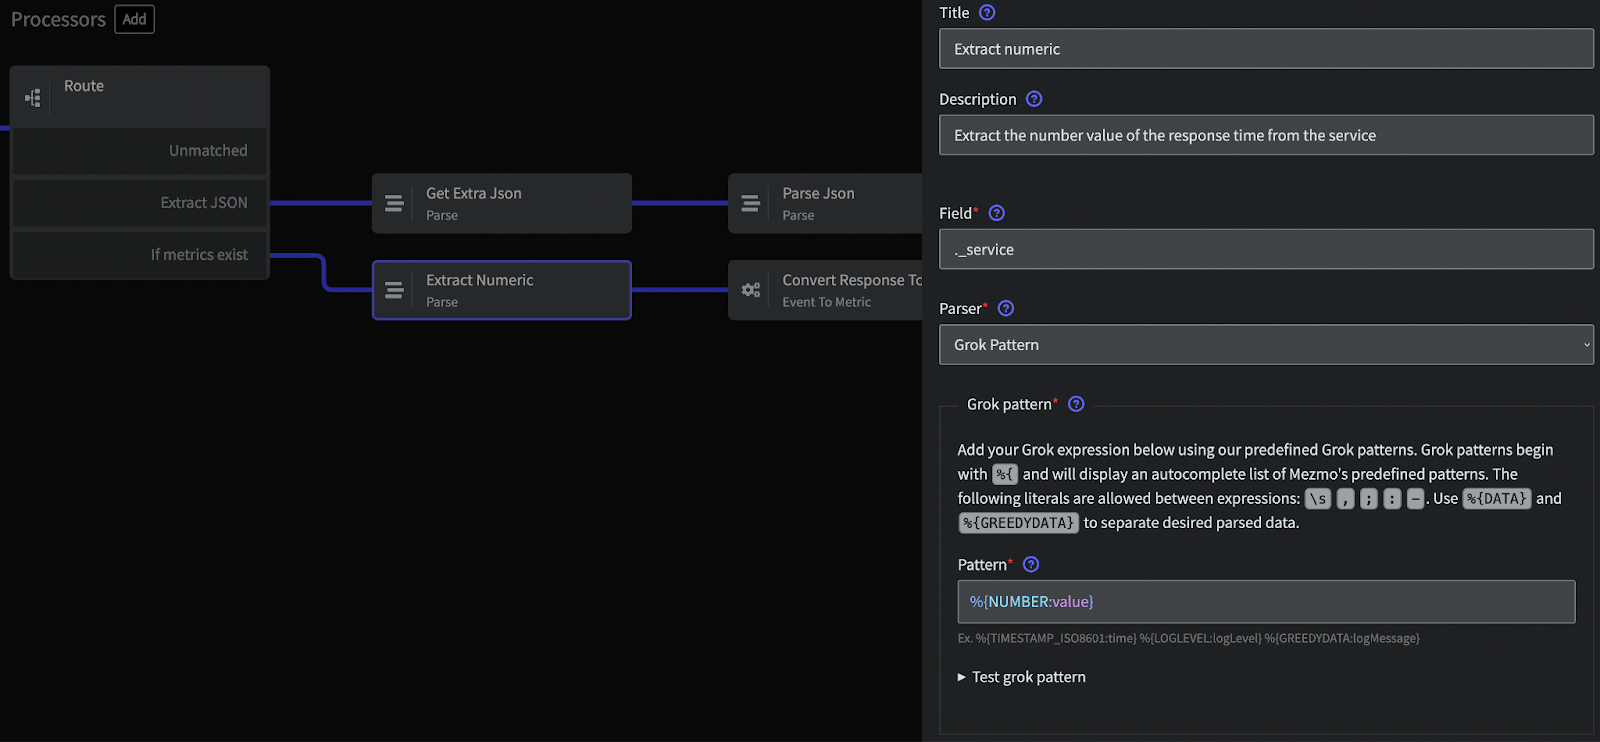
You start the extraction process by parsing numeric data from your logs. For instance, you may have a log message that includes response times for a service. Using Mezmo, you can parse these times into numeric values that can then be processed and analyzed. For example:
In this log message, you can parse 45 as a numeric value, giving you essential information about your service's performance.
Refining Gold: Metric Transformation
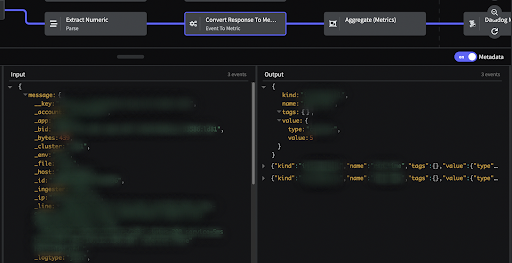
Once you have extracted the numeric data from your logs, it still needs to be in a form you can use effectively. For this, you need to refine it into a standardized format. Metric transformation does that. It allows you to convert the parsed numeric data into a more straightforward form, making it possible to perform operations such as sum, count, min, max, etc.
Let’s illustrate this with examples from a variety of sources.
Web Server Logs
Example Log Entry
Format Explanation
The above log is a typical log entry from an Apache web server. It includes the client IP address, the user identifier, the timestamp of the request, the HTTP method, the request URI, the HTTP version, the response's status code, and the response size in bytes.
Possible Metrics
- Count of HTTP requests
- Volume of data sent
- Count of each type of HTTP status code
Metric Transformation Details
To extract metrics from Apache logs, Mezmo provides the Mezmo Parse Processor specifically designed for Apache logs. This processor allows you to parse the log entry and create structured data. Once you have the structured data, you can apply a grok pattern to extract relevant fields and generate metrics.
Here's a sample grok pattern for Apache logs that you can use with the Mezmo Parse Processor:
This pattern would parse the log entry and create structured data with fields for each part of the log entry. You could then generate metrics from the ‘status’ and ‘response_size’ fields.
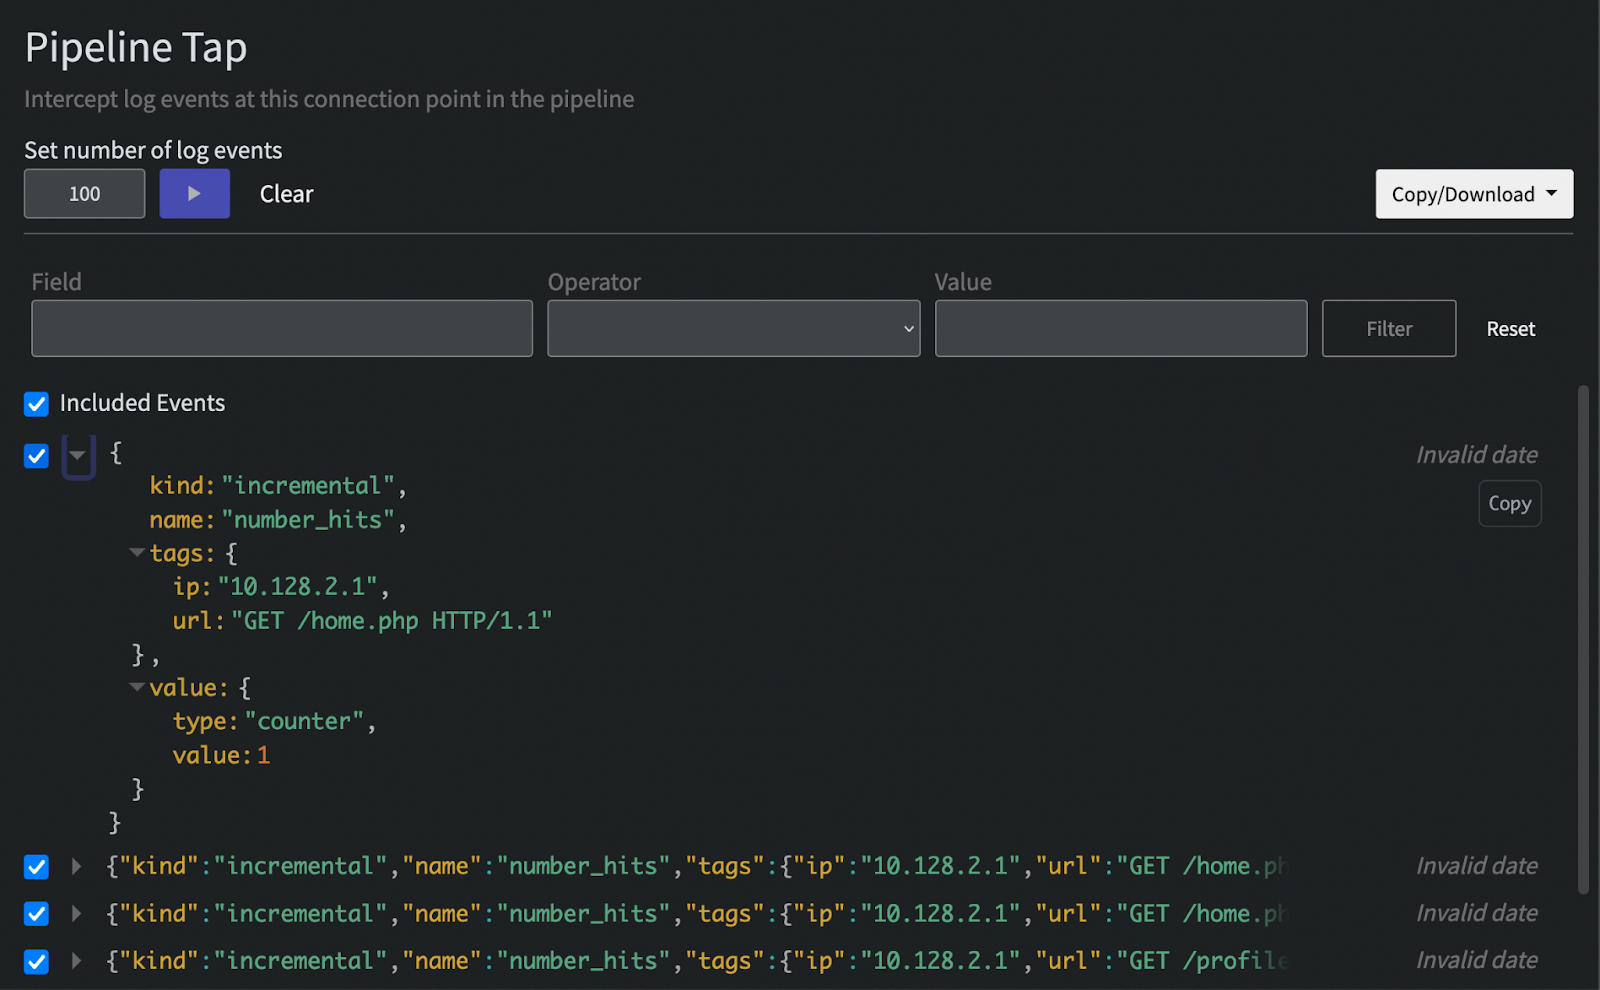
An example metric here would be:
Database Logs
Example Log Entry
Format Explanation
The above log is a typical log entry from a PostgreSQL database. It includes the timestamp of the query, the process ID, the database name, the user name, the log level, the duration of the query in milliseconds, and the executed SQL statement.
Possible Metrics
From this log, you can derive several metrics, such as:
- Count of SQL queries
- Total duration of SQL queries
- Count of each type of SQL statement (SELECT, INSERT, UPDATE, DELETE, etc.)
Metric Transformation Details
You could extract these metrics using a grok pattern like this:
This pattern would parse the log entry and create structured data with fields for each part of the log entry. Afterwards, you could generate metrics from the ‘query_duration’ and ‘query’ fields.
An example metric here would be:
Application Logs
Example Log Entry
Format Explanation
The above log is a typical log entry from an application using a logging framework like Logback or log4j. It includes the log level, the timestamp of the event, the logger name, and a message describing the event.
Possible Metrics
- Count of each log level (INFO, WARN, ERROR, etc.)
- Count of specific events (like user logins)
Metric Transformation Details
You can extract these metrics using a grok pattern like the following one.
Using this grok pattern would parse the log entry, creating structured data with fields for each part of the log entry. You could then generate metrics from the 'log_level' and 'message' fields by looking for specific phrases in the 'message.'
An example metric here would be:
Mezmo: Powerful Extraction and Flexible Conversion
Metric Transformation turns raw telemetry data into valuable insights akin to a gold prospector finding nuggets among rocks. The metrics you extract depend on your specific use case and application requirements. Regardless, Mezmo's versatility enables you to handle various logs - web server, database, or application logs.
Best Practices for Tagging Metrics
As a practitioner, you have the flexibility to choose the tagging approach that suits your needs. You can assign static tags based on expected data types or utilize more dynamic tags derived from the log events themselves. Ultimately, this flexibility ensures that your metrics align with your specific use case.
When adding static tags, you’ll want to be certain the events that are made into metrics all match the defined criteria in your filter. For example, you may wish to define tags for the various zones where your data originates. You could use a CIDR filter to define the ranges of IPs and then route them each for assignment to unique static tag values, but be sure the criteria is mutually exclusive by testing at the end and beyond of each CIDR condition.
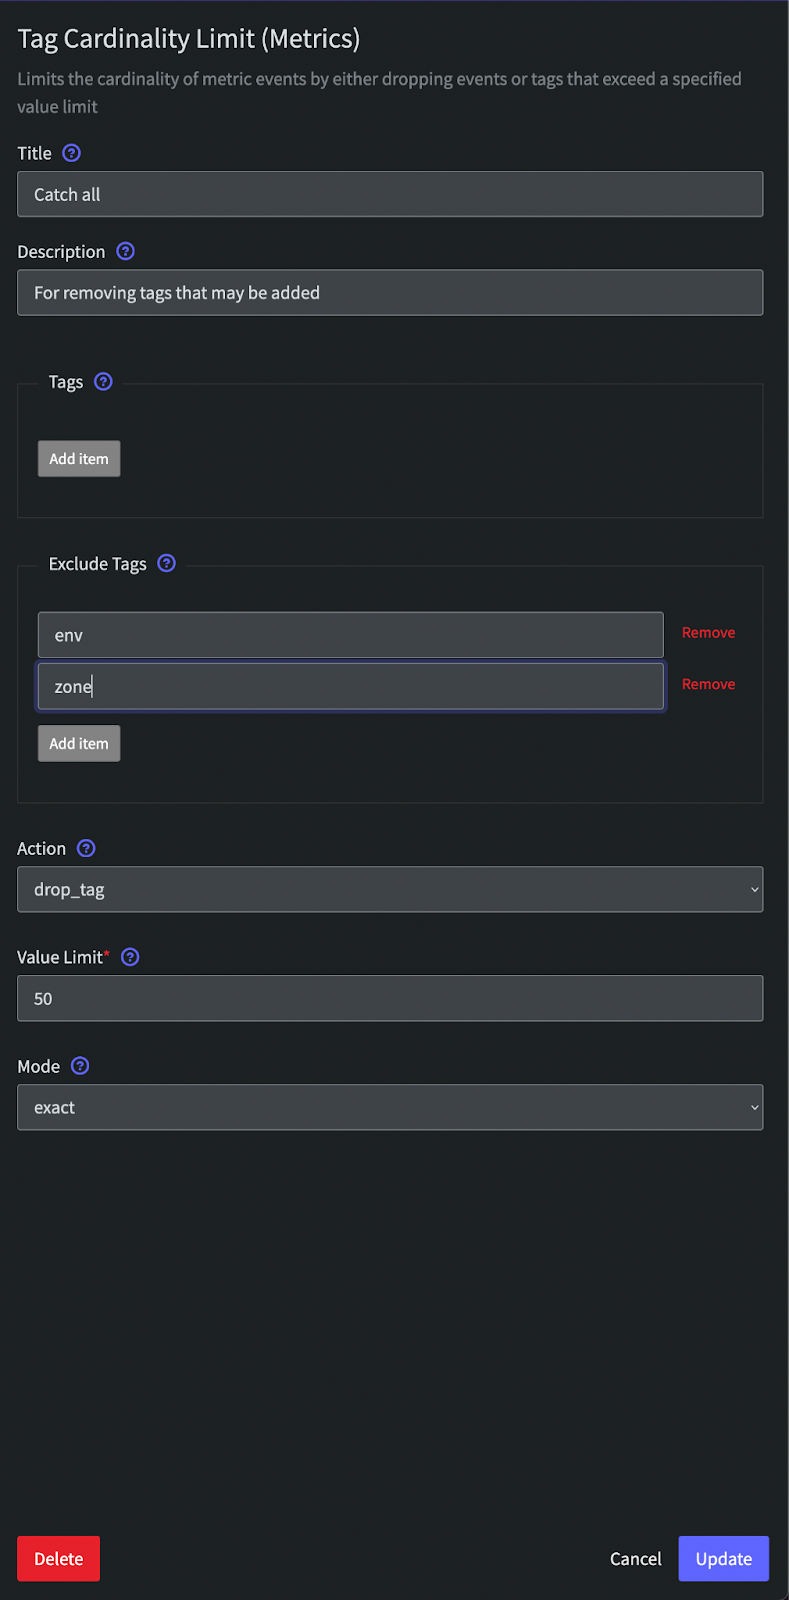
When converting tags from values in the event, ensure you fully understand the cardinality of that tag value. For example, using hostname as a tag can be quite valuable for downstream analysis, but significantly impacts the amount of data and billing you may get from your metrics storage tool. This is because large numbers of unique tag values, or high cardinality, can cause data duplication downstream. For other cases where you don’t expect cardinality, it’s still a good practice to add a Tag Cardinality limiting processor immediately after you convert your event to a metric. This ensures that you don’t get unexpected bills downstream in case of a change upstream.
Managing the Library: Implementing Cardinality Management
Once you've obtained your goldmine of metrics through the Mezmo Telemetry Pipeline, it's important to ensure the quality and efficiency of your data, just as a goldsmith carefully manages the purity and composition of their gold. In the world of metrics, cardinality management plays a crucial role. It allows you to control the diversity and quality of unique combinations of tag values in your metrics. By managing cardinality, you ensure that your metric data remains efficient and manageable, striking the right balance between capturing essential details and maintaining log analysis efficiency.
To implement cardinality management within Mezmo, follow these steps:
- Create a Processor: In the Mezmo user interface, click the "Add" button and select "Tag Cardinality Limit (Metrics)." Link this processor to the metric source or group containing the entries you want to manage.
- Configure the Tag Cardinality Limit (Metrics) Processor: In the processor configuration, specify the maximum number of unique tags you want to allow using the 'Value Limit' field within the 'tags' setting. A good starting point is to set a value of 100 if you're unsure of how many tag values you might have. You can choose to go higher if you need more flexibility or if your metric volume is low.
- Define the Action: Decide what action Mezmo should take when exceeding the defined cardinality limit. You can choose to drop or modify the metrics, or trigger an alert for further investigation.
- Save and Apply the Processor: Save the processor configuration and apply it to your metric source or metric group.
Implementing cardinality management ensures the clarity and purity of your metrics. It enables you to extract precise and actionable insights by retaining focus on the most valuable metrics while preventing overwhelming variations. By effectively managing the diversity of unique tag combinations, you optimize your log analysis process and unlock the true value of your metrics.
Tip: For more specific instructions on configuring the Tag Cardinality Limit (Metrics) Processor, refer to our documentation on the processor. Doing this ensures you have the most up-to-date and detailed information.
Showcasing Refined Gold: Routing and Analyzing Metrics
Now that you've gone through the process of extracting, transforming, tagging, and managing the cardinality of your metrics, it's time to put that data to work. Mezmo is a robust telemetry pipeline that enables you to route your metrics to virtually any destination, unlocking their full potential.
With Mezmo's versatile telemetry pipeline, you can seamlessly route your metrics to the destinations of your choice. Whether it's popular monitoring platforms, data analysis tools, or custom-built systems, Mezmo provides the flexibility to connect and send your advanced metrics where needed.
By leveraging Mezmo's intuitive interface and robust routing capabilities, you can ensure that your refined metrics go to the appropriate destinations for further analysis and utilization.
Mezmo's extensive integration ecosystem allows you to connect with a wide range of platforms, such as:
- Mezmo Log Analysis: Mezmo's built-in feature for log analysis within Mezmo provides advanced insights and querying capabilities for metric and log data.
- Grafana: A data visualization and monitoring platform. Mezmo integrates with Grafana to seamlessly route refined metrics, enabling interactive dashboards and insights.
- Datadog: A comprehensive monitoring and analytics platform. Mezmo integrates with Datadog to send refined metrics for advanced monitoring and alerting.
- Prometheus: An open-source monitoring and alerting toolkit. Mezmo integrates with Prometheus to route refined metrics, leveraging powerful alerting and querying capabilities.
- Splunk: A platform for collecting and analyzing machine-generated data. Mezmo integrates with Splunk for forwarding refined metrics, enabling search and analysis features.
- Elastic: An open-source search and analytics platform. Mezmo integrates with Elastic to route refined metrics to Elasticsearch, unlocking powerful search and analytics capabilities.
- Amazon Web Services (AWS): AWS is Amazon's cloud computing platform. Mezmo integrates with AWS services, such as CloudWatch, for monitoring and analyzing refined metrics.
- Google Cloud Platform (GCP): Google's cloud computing platform. Mezmo integrates with GCP services like Stackdriver for monitoring and analyzing refined metrics.
- Azure: Microsoft's cloud computing platform. Mezmo integrates with Azure services, such as Azure Monitor, for monitoring and analyzing refined metrics.
Once you've routed your metrics, you can leverage the power of these destinations to perform in-depth analysis, gain valuable insights, and drive actionable decision-making. Mezmo's telemetry pipeline acts as the conduit, enabling you to extract maximum value from your metrics.
Mezmo's telemetry pipeline channels your refined metrics to the proper analysis tools, monitoring platforms, or custom systems, ensuring that you leverage your metrics effectively to monitor system performance, detect anomalies, identify trends, and drive operational excellence.
With Mezmo, you can route and analyze your metrics, unleashing their true potential and extracting actionable insights to optimize your systems effectively.
Conclusion
Like mining gold from ore, deriving metrics from logs is a process. It requires parsing, transformation, tagging, and cardinality management. Following these steps, you can convert your raw log data into valuable insights, helping you monitor and optimize your systems.
Mezmo Telemetry Pipeline makes this process simple and effective through its efficient and user-friendly interface. So, next time you look at your logs, remember - you have a gold mine of information waiting to discover. Mezmo can give you the shovel, help you dig, and provide a continuous stream of gold from your telemetry data.
Ready to start extracting valuable metrics from your logs?
Try Mezmo Telemetry Pipeline today and experience the power of turning your log data into actionable insights. Sign up for a free trial now!
Similar blog posts


