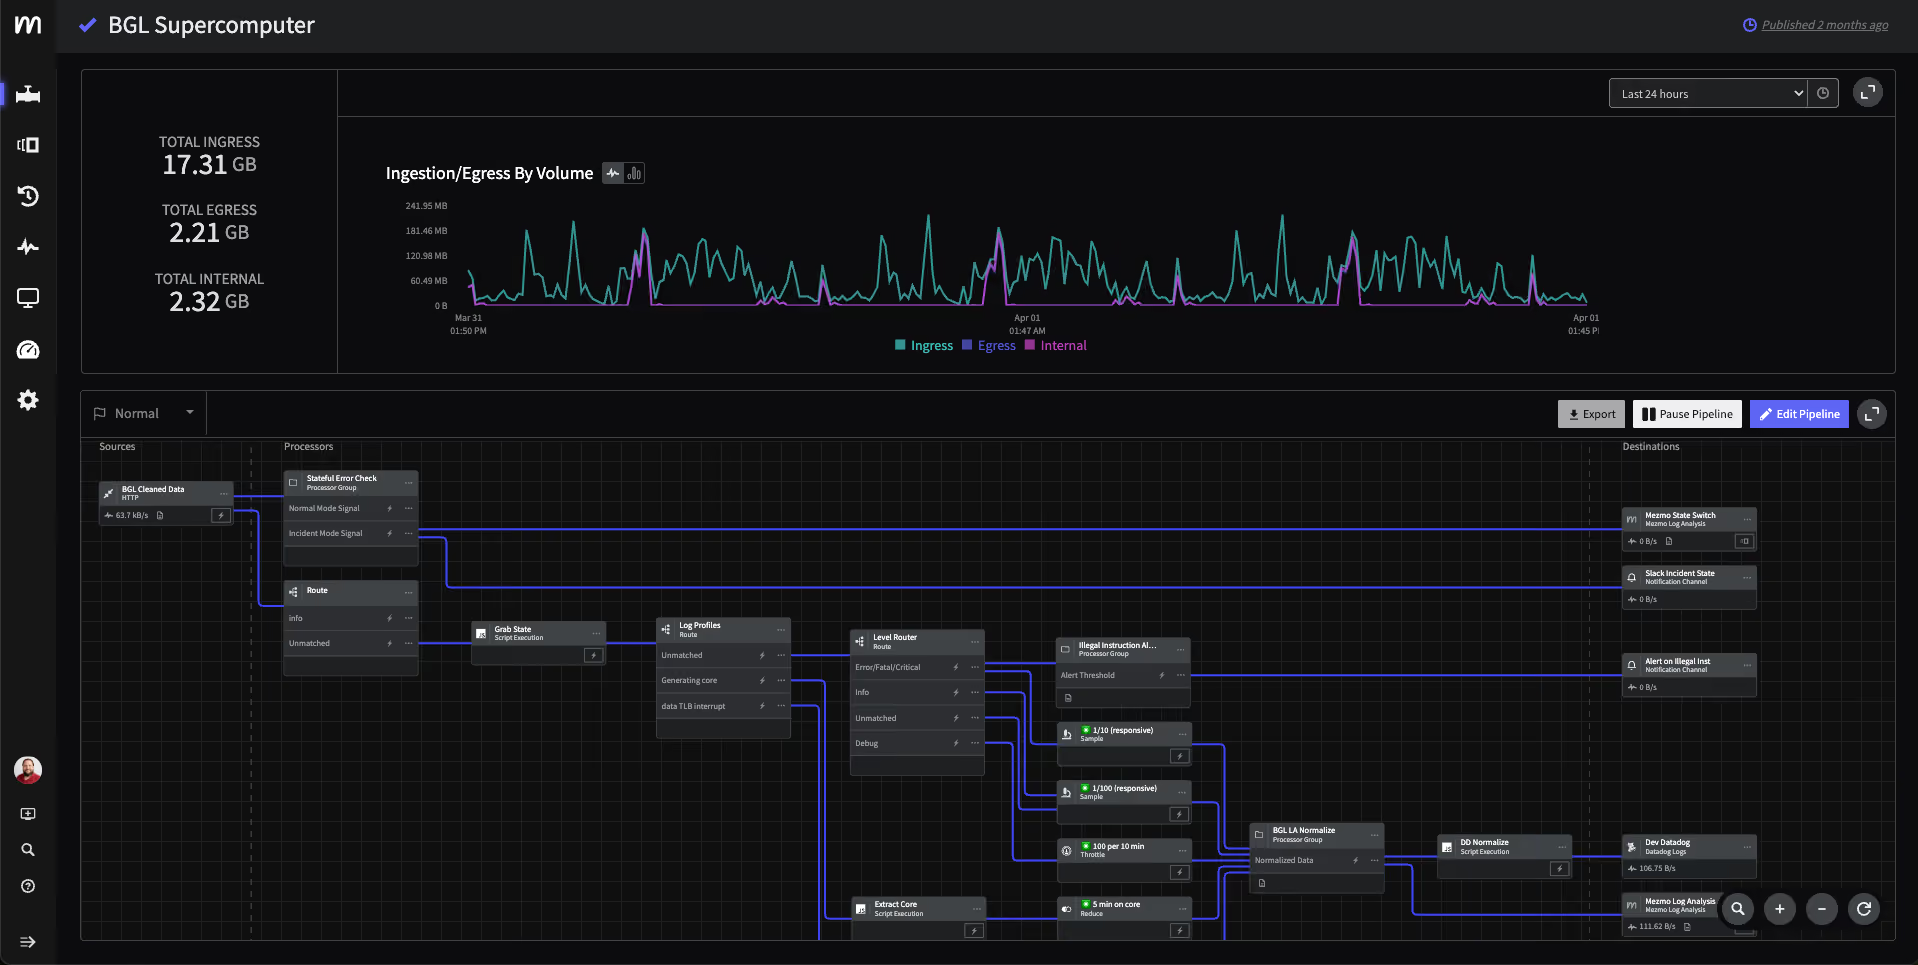
How to Reduce Log Volume Without Losing Visibility

Ask about this page
Perplexity
Grok

Why log volume reduction matters now

Log volume reduction has shifted from a nice-to-have to a core requirement for modern engineering teams. As systems grow more distributed and data-heavy, the cost, noise, and operational drag of uncontrolled logs become impossible to ignore. Three forces are driving this urgency:

Cloud scale and microservices create excess events

Cloud-native architectures generate far more telemetry than traditional systems ever did. Each microservice - often ephemeral, autoscaled, and deeply interconnected - produces its own logs, traces, and metrics. Multiplied across clusters, regions, and environments, this creates massive event floods. Most of these events aren’t actionable; they just accumulate into costly noise.

Verbose defaults and weak rotation inflate data

Most frameworks, libraries, and infrastructure components ship with overly verbose logging defaults (debug, info, full stack traces, repeated connection noise, heartbeat logs). On top of that, weak or legacy retention/rotation policies let low-value logs pile up indefinitely. The result: organizations pay premium storage and egress fees for data that will never be queried.

Log reduction is not the same as losing insight

The biggest misconception is that reducing logs reduces visibility. In reality, the goal is to eliminate waste - duplicates, noise, overly verbose messages, and infrastructure chatter - while preserving (and often improving) the signals that matter. When done right, log reduction sharpens observability: you extract high-quality, semantically rich events instead of drowning insights in volume.

Proven ways to reduce log volume

Modern systems generate more telemetry than teams can reasonably store, search, or pay for. Reducing log volume isn’t about cutting corners: it’s about shaping data before it becomes waste. These proven techniques help you shrink cost, reduce noise, and keep the signals that actually matter.

Standardize log levels across services

Inconsistent logging practices lead to unpredictable volumes and unnecessary verbosity. Aligning teams on clear definitions - DEBUG for development, INFO for normal operations, WARN for anomalies, ERROR for failures - prevents services from over-logging by default. Standardizing levels ensures logs reflect true severity and keeps low-value noise from entering the pipeline in the first place.

Centralize collection and routing with an observability pipeline

A modern pipeline (like Mezmo Telemetry Pipeline) acts as a control plane for all logs. Instead of sending raw data directly to expensive storage platforms, you collect once and route intelligently. Pipelines let you enforce policies, shape data, redact sensitive fields, fan out high-value signals, and drop low-value ones. Centralization brings consistency and avoids “shadow pipelines” that inflate volume and cost.

Extract metrics upstream to avoid indexing every event

Most time-series questions (request rates, error counts, latency, resource usage) don’t need full log bodies. By converting high-cardinality or repetitive logs into metrics at the pipeline or agent level, you preserve insight while dramatically shrinking storage. Metrics are cheaper, faster to query, and better suited for monitoring patterns than raw logs.

Deduplicate and sample the right data

Logs often contain repetitive noise: identical errors, recurring health checks, retry loops, or chatty services emitting near-duplicate lines. Deduplication compresses this into a single representative event with a count. Sampling keeps statistically meaningful data (like every nth request or only errors after a threshold) while shedding excess volume. Both techniques protect signal fidelity while taming event floods.

Apply quotas for noisy sources

Some services, pods, or teams naturally generate more data than others. Without controls, a single misconfigured component can overwhelm your entire budget. Setting quotas - per namespace, service, or team - prevents runaway logging. When usage exceeds a threshold, logs can be throttled, rerouted, summarized, or temporarily downgraded to avoid operational disruption.

Tier cold data with on demand rehydration

Not all logs need hot, indexed storage. You can keep recent events in fast search systems while pushing older or lower-value data to cheap object storage. When historical analysis is required, rehydrate only the slices you need. This avoids paying premium costs for data that may never be touched while maintaining full access when it matters.

Together, these practices let you cut log volume by 40–70% while improving signal clarity and reliability. They shift the focus from collecting everything to collecting the right things—preserving actionable insight and drastically reducing cost.

How Mezmo enables effective log reduction

Mezmo is purpose-built to help teams control, shape, and optimize telemetry at scale, reducing log volume intelligently rather than blindly cutting data. It gives you granular control over what you collect, how you enrich it, where it goes, and how much of it you keep hot. These core capabilities make meaningful log reduction possible without losing visibility.

Active Telemetry shapes data in motion

Instead of collecting everything and filtering later, Mezmo applies transformations as data flows through the pipeline.

Active Telemetry lets you:

  • Drop noise before it becomes cost
  • Trim verbose payloads and remove redundant fields
  • Extract metrics upstream so logs don’t inflate indexes
  • Normalize inconsistent formats from different services
  • Adapt filtering rules dynamically based on context

By shaping data during ingestion, Mezmo prevents waste from ever reaching downstream systems, reducing cost and noise at the source.

Context engineering enriches and routes by policy

Mezmo treats context as a first-class control layer. The platform enriches incoming logs with metadata and evaluates routing decisions against clear policies. This ensures:

  • High-value events are routed to premium analytics systems
  • Routine or verbose logs are sent to cheaper storage
  • Sensitive data is masked, redacted, or isolated
  • Events are grouped or correlated to reduce volume without losing meaning

Context engineering ensures that every log is handled according to its purpose, not blindly indexed.

Built-in reduction, dedupe, and quota controls

Mezmo includes native mechanisms to automatically clamp down on excessive telemetry:

  • Dedupe: Collapse repeated messages (retry storms, identical errors, chatty services) into single events with counters.
  • Sampling: Keep representative or statistically significant samples while discarding excess.
  • Quotas: Prevent a single noisy service or cluster from blowing up your budget.

These controls ensure that spikes, bugs, or misconfigurations don’t flood your downstream systems with garbage data.

Flexible tiering that preserves full fidelity when needed

Mezmo separates hot visibility from cold retention so you don’t pay premium prices for every event. You can:

  • Keep recent or high-value logs in real-time search
  • Push everything else to low-cost object storage
  • Rehydrate only what you need, when you need it

This means you maintain full-fidelity data without permanent high-cost indexing which is perfect for compliance, audits, or root-cause analysis without constant overhead.

Mezmo delivers log reduction that’s smart, not blunt. It shapes telemetry in motion, routes it by context, automatically reduces waste, and manages data across tiers, all while preserving the insights engineers and AI systems rely on.

How to reduce my log volumes with Mezmo

Reducing log volume isn’t about cutting visibility; it’s about cutting waste. Mezmo gives you the control plane to shape, route, and optimize telemetry before it becomes costly. Here’s the proven approach teams use to reduce volume safely and systematically.

Define level standards and schemas

Start by establishing consistency. Mezmo helps you enforce clear standards across services so you don’t ingest unnecessary noise in the first place.

  • Normalize log levels (DEBUG, INFO, WARN, ERROR)
  • Define schemas so fields are predictable and easy to evaluate
  • Set expectations for message format, verbosity, and metadata

This prevents uncontrolled growth and makes downstream reduction policies more accurate.

Set reduction and routing policies

With structure in place, you can apply Mezmo’s Active Telemetry and context rules to shape data in motion.

Use Mezmo to:

  • Drop or trim low-value logs (health checks, heartbeat noise, duplicate messages)
  • Extract metrics from repetitive logs so they don’t inflate indexes
  • Route errors and high-value signals to premium systems
  • Send verbose or infrequent logs to cheaper storage tiers
  • Apply deduplication, sampling, and quotas to clamp down on excess

Policies allow you to keep the meaningful 20% of logs while eliminating the wasteful 80%.

Validate with test streams and KPI baselines

Before rolling changes into production, Mezmo lets you run policies against test streams to preview impact.

Validate:

  • Log volume reduction (%)
  • Error visibility and coverage
  • Impact on MTTD/MTTR
  • Cost reduction vs. data retention needs

Treat reduction as an engineering change—not a guess. Baselines ensure you preserve signal while shedding noise.

Monitor drift and optimize continuously

Logging patterns change as teams ship new features, expand clusters, or modify frameworks. Mezmo helps you stay ahead of drift.

Continuously monitor:

  • Services that become noisy again
  • Chatty integrations or third-party libraries
  • Quota breaches or sampling thresholds
  • Unexpected schema changes
  • Hot vs. cold tier utilization

As systems evolve, so should your policies. Mezmo makes ongoing optimization a normal part of operations, not a fire drill.

With Mezmo, reducing log volume is a controlled, iterative process - standardize your data, apply smart policies, validate the impact, and continuously refine. The result: lower costs, clearer signals, and a more efficient observability practice.

Mezmo Log Volume Reduction Checklist 

A practical one-pager to cut waste, sharpen signal, and reduce observability cost.

1. Define Level Standards & Schemas

  • ☐ Align teams on consistent log levels (DEBUG, INFO, WARN, ERROR)
  • ☐ Remove or discourage verbose defaults in application frameworks
  • ☐ Establish a shared log schema (timestamp, service, severity, request ID, etc.)
  • ☐ Normalize field names and message structures across services
  • ☐ Document expectations for structured vs. unstructured logs

2. Set Reduction & Routing Policies (in Mezmo)

  • ☐ Drop low-value events (health checks, noise, duplicates)
  • ☐ Trim oversized payloads and remove unnecessary fields
  • ☐ Extract metrics from repetitive logs to avoid indexing every event
  • ☐ Apply dedupe and sampling rules
  • ☐ Set quotas for noisy services or namespaces
  • ☐ Route high-value logs to premium search systems
  • ☐ Route verbose or infrequent logs to cheaper object storage tiers

3. Validate Policies Before Rollout

  • ☐ Use Mezmo test streams to preview policy impact
  • ☐ Compare against KPI baselines (MTTD, MTTR, error visibility)
  • ☐ Measure expected log reduction (%)
  • ☐ Confirm no critical signals are lost
  • ☐ Estimate cost savings and storage impact
  • ☐ Document rollback or adjustment paths

4. Monitor Drift & Optimize Continuously

  • ☐ Track changes in log patterns as services evolve
  • ☐ Identify new noisy sources or misconfigured components
  • ☐ Watch quota thresholds and sampling triggers
  • ☐ Audit schema consistency and metadata quality
  • ☐ Revisit routing rules as costs, SLAs, and architectures change
  • ☐ Review hot vs. cold tier usage and adjust retention windows

Outcome:

A continuously optimized telemetry flow where Mezmo shapes data in motion, eliminates waste before it becomes cost, preserves the signals that matter, and keeps your observability spend predictable and efficient.

KPIs to prove log volume reduction

Reducing log volume is only valuable if it improves cost efficiency and operational performance. These KPIs help you quantify the impact and demonstrate that you’re removing waste, not visibility.

Indexed volume by source and level

This KPI shows exactly where logs are coming from and how much of that data is being stored in expensive, indexed systems.

Track:

  • Indexed GB per service, pod, or namespace
  • Volume by log level (DEBUG/INFO vs. WARN/ERROR)
  • Reductions after policy changes

A healthy reduction effort shifts volume away from low-value sources and levels, while preserving or improving the proportion of ERROR and WARN signals. This proves you’re improving signal density, not losing insight.

Cost per GB and per incident

Volume reduction should translate directly to cost efficiency. These KPIs highlight the financial impact:

  • Cost per GB ingested → shows how routing, dedupe, and tiering reduce spend.
  • Cost per incident resolved → measures the total cost of the telemetry required to diagnose issues.

A drop in these metrics indicates that you're successfully reducing hot storage, search load, and ingest costs without hindering incident response. This ties log reduction to measurable business value.

Time to detect and resolve

These operational KPIs ensure that reduction efforts don’t degrade visibility or reliability.

Track:

  • MTTD before vs. after reduction policies
  • MTTR across common incident types
  • Coverage of critical errors and anomalies

If MTTD and MTTR stay stable - or improve - while volume drops, it proves you removed noise, not signal. In many cases, reduced volume leads to faster queries, clearer dashboards, and more focused alerts, which directly improve detection and resolution times.

Together, these KPIs prove three things:

  1. You reduced indexed volume intelligently (not blindly).
  2. You lowered observability cost per GB and per incident.
  3. You maintained or improved operational performance (MTTD/MTTR).

This is the evidence leadership teams want to see: less data, lower cost, and better outcomes.

Table of contents

    More articles

    What Is Log Rehydration? Understanding the Process and Benefits
    What Is Log Rehydration? Understanding the Process and Benefits
    Log Management
    Log Metrics: What are they? How can they be used? What insights can be garnered at scale?
    Log Metrics: What are they? How can they be used? What insights can be garnered at scale?
    Log Management
    What is MultiCloud Monitoring & Management?
    What is MultiCloud Monitoring & Management?
    Log Management
    Live Tail: What It Is, Why It’s Useful, How To Use It
    Live Tail: What It Is, Why It’s Useful, How To Use It
    Log Management
    Log Data: What it is and why it matters
    Log Data: What it is and why it matters
    Log Management
    Istio Logging 101
    Istio Logging 101
    Log Management
    How to Use JSON Logs
    How to Use JSON Logs
    Log Management
    Understanding and Leveraging AWS Cloudwatch Logs
    Understanding and Leveraging AWS Cloudwatch Logs
    Log Management
    What Is a Tail Log?
    What Is a Tail Log?
    Log Management
    How to Use S3 Access Logs
    How to Use S3 Access Logs
    Log Management
    Benefits of Data Logging
    Benefits of Data Logging
    Log Management
    What is Real-time Log Monitoring?
    What is Real-time Log Monitoring?
    Log Management
    Managing Digital Compliance During Digital Transformation
    Managing Digital Compliance During Digital Transformation
    Log Management
    A Comprehensive Guide to Kubernetes Monitoring Tools
    A Comprehensive Guide to Kubernetes Monitoring Tools
    Log Management
    The Role of Infrastructure Monitoring in DevOps
    The Role of Infrastructure Monitoring in DevOps
    Log Management
    5 Practical Ways to Build a Secure CI/CD Pipeline
    5 Practical Ways to Build a Secure CI/CD Pipeline
    Log Management
    Why and How to Analyze Deployment Health Through CI/CD Logs
    Why and How to Analyze Deployment Health Through CI/CD Logs
    Log Management
    What is Application Lifecycle Management
    What is Application Lifecycle Management
    Log Management
    What Is A Real-Time Dashboard?
    What Is A Real-Time Dashboard?
    Log Management
    Log Indexing and Rotation for Optimized Archival
    Log Indexing and Rotation for Optimized Archival
    Log Management
    What is Log Rotation? How Does it Work?
    What is Log Rotation? How Does it Work?
    Log Management
    Logging for Application Security
    Logging for Application Security
    Log Management
    How Do You Manage Logs?
    How Do You Manage Logs?
    Log Management
    How Custom Parsing Can Boost Developer Productivity
    How Custom Parsing Can Boost Developer Productivity
    Log Management
    7 Best Practices for Log Management and Analytics
    7 Best Practices for Log Management and Analytics
    Log Management
    Enhancing Communication Across Your Teams With Logging
    Enhancing Communication Across Your Teams With Logging
    Log Management
    Which Log Files Should Users Onboard to Build an Observability Platform?
    Which Log Files Should Users Onboard to Build an Observability Platform?
    Log Management
    What Information Does Log Aggregation Capture?
    What Information Does Log Aggregation Capture?
    Log Management
    The Key Benefits of Log Data
    The Key Benefits of Log Data
    Log Management
    Planning Your Log Collection
    Planning Your Log Collection
    Log Management
    Capturing the Most Critical Information Within Your Logs
    Capturing the Most Critical Information Within Your Logs
    Log Management
    The Importance of Data Privacy and Confidentiality for Log Management
    The Importance of Data Privacy and Confidentiality for Log Management
    Log Management
    SOC 2 and its Benefits
    SOC 2 and its Benefits
    Log Management
    Logging for Microservices
    Logging for Microservices
    Log Management
    System Logging Best Practices
    System Logging Best Practices
    Log Management
    Why HIPAA and Compliance Matters to Logging
    Why HIPAA and Compliance Matters to Logging
    Log Management
    Application Security and Compliance through Logging
    Application Security and Compliance through Logging
    Log Management
    Log Management Compliance for Saas Applications
    Log Management Compliance for Saas Applications
    Log Management
    What is Log Aggregation? Log Aggregation Explained
    What is Log Aggregation? Log Aggregation Explained
    Log Management
    What is Log Analysis?
    What is Log Analysis?
    Log Management
    What to Look for in a HIPAA-Compliant Log Management Tool
    What to Look for in a HIPAA-Compliant Log Management Tool
    Log Management
    What is Structured Logging?
    What is Structured Logging?
    Log Management
    Why Is Log Management Important?
    Why Is Log Management Important?
    Log Management
    Top Use Cases for Log Analysis
    Top Use Cases for Log Analysis
    Log Management