The Spike Protection Bundle with Index Rate Alerting

4 MIN READ
MIN READ

LogDNA is now Mezmo but the product you know and live is here to stay.

For DevOps teams that want to accelerate release velocity and improve reliability, logs can unlock the insights you need to move faster. But for managers and budget owners, logging can be an unpredictable pain. Trying to estimate logging spend, especially with the adoption of microservices and container-based architecture, seems like an impossible task. This is why Mezmo, formerly known as LogDNA is focused on delivering features that help you better control the flow of log data to ensure that your teams get the insights they need, while also giving you the ability to better understand and predict spend. 

To help with this effort, we released Usage Quotas earlier this year to give you further control on the amount of data your organization ingests with Mezmo. These hard and soft quotas help you stay within your budget without sacrificing valuable insight into important logs. 

Today, we’re excited to release Mezmo's Index Rate Alerting feature to complete the Spike Protection bundle so that you can be notified of increases before you hit your quota.

Get Alerted on Unexpected Spikes in Ingestion

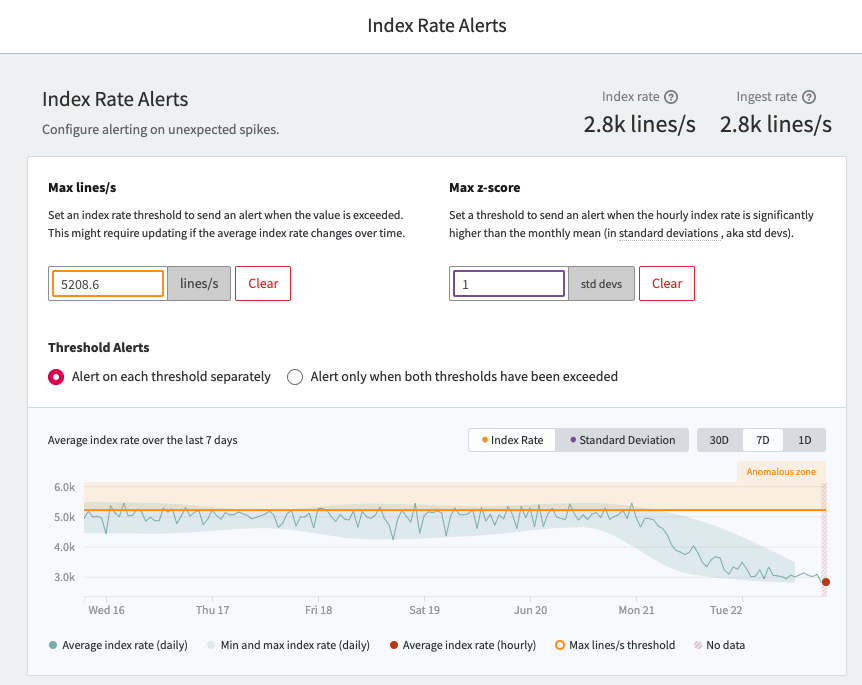
With Index Rate Alerting, you can receive notifications if the volume of indexed logs in your organization grows unexpectedly. You can monitor the index rate of logs with a fixed threshold under the Index Rate Alert Threshold feature. Set a maximum flow rate you would expect, and Mezmo will alert you if the flow rate into your index exceeds that threshold. 

Mezmo Index Rate Alert Threshold


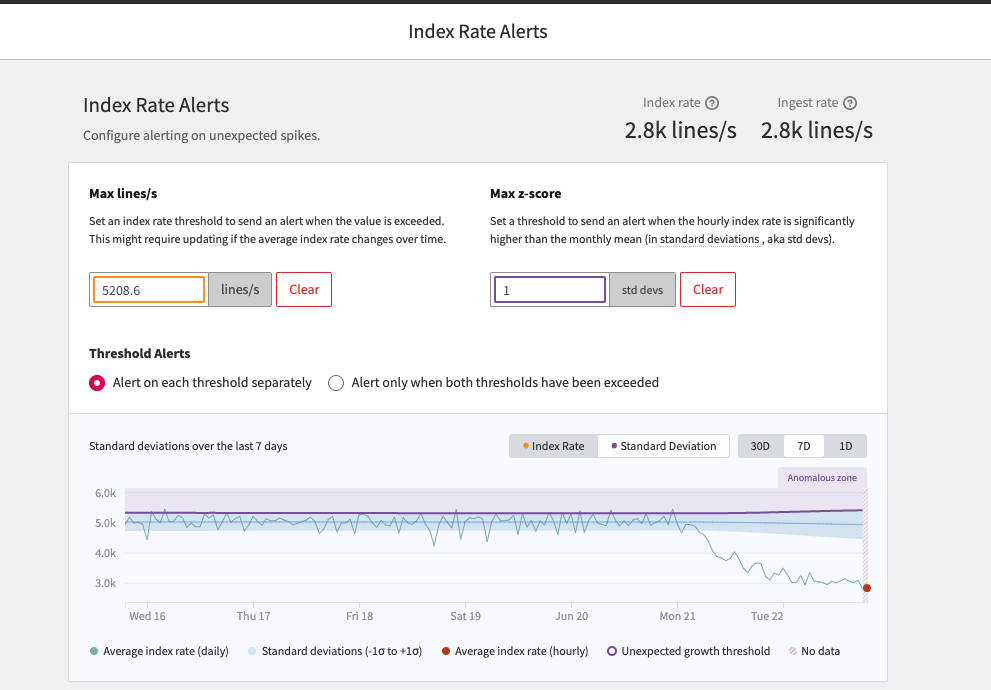
To detect anomalous increases in index rate, you can use our Standard Deviation Alert to monitor when your account is ingesting significantly more data than the norm. When you enable Index Rate Alerting, Mezmo takes your index rate data from the past 30 days to understand what is ‘normal’ for your organization, and will trigger an alert if you are sending significantly more logs than measured as normal. Please note that if you let the high volume go on for a few days, Mezmo will adjust what's ‘normal’ to a higher limit. 

Mezmo Standard Deviation Alert

What Can You Do with Index Rate Alerting?

Index Rate Alerting can protect against an increase in storage costs caused by unexpected spikes in log volume. Spikes can be caused by a runaway log, someone forgetting to turn off debug, or a developer deploying a new app that is causing a large increase in log volume. Now, you can set up alerts to be notified of these changes so that you don’t exceed your set quota. 

What to Do After You Get an Alert

Most admins investigate where a spike is coming from by using our visualization tools to graph all existing apps and sources to determine which one(s) are causing the spike. We included that information in the alert so that you can skip this step. Every alert triggered will come with a list of apps and sources that have seen the biggest flow rate change in the last hour to help you identify where the spike may be coming from. We will also include a list of the newest apps and sources added to Mezmo to help you better diagnose a spike, in the case the increase in log volume is from new apps deployed without your knowledge. 

Bonus Feature

You've been asking for a way to see all the data associated with all the apps and sources in your organization. We couldn’t fit all of the information you might want to understand about a spike on an alert, so we built a way for you to grab this data from the usage dashboard page. 


Mezmo Usage Dashboards


Get Started with Index Rate Alerting

Index Rate Alerting is available for all Mezmo enterprise users and is restricted to Owner and Admin roles. To learn more about how to enable this feature, please reference our documentation or get in touch with your dedicated Customer Success Manager. If you’re not yet an enterprise user and would like to learn how to get access to this feature, please email outreach@mezmo.com.

We love getting feedback about our features and how they help you better control your logs.

Table of Contents

    Share Article

    RSS Feed

    Next blog post
    You're viewing our latest blog post.
    Previous blog post
    You're viewing our oldest blog post.
    Mezmo + Catchpoint deliver observability SREs can rely on
    Mezmo’s AI-powered Site Reliability Engineering (SRE) agent for Root Cause Analysis (RCA)
    What is Active Telemetry
    Launching an agentic SRE for root cause analysis
    Paving the way for a new era: Mezmo's Active Telemetry
    The Answer to SRE Agent Failures: Context Engineering
    Empowering an MCP server with a telemetry pipeline
    The Debugging Bottleneck: A Manual Log-Sifting Expedition
    The Smartest Member of Your Developer Ecosystem: Introducing the Mezmo MCP Server
    Your New AI Assistant for a Smarter Workflow
    The Observability Problem Isn't Data Volume Anymore—It's Context
    Beyond the Pipeline: Data Isn't Oil, It's Power.
    The Platform Engineer's Playbook: Mastering OpenTelemetry & Compliance with Mezmo and Dynatrace
    From Alert to Answer in Seconds: Accelerating Incident Response in Dynatrace
    Taming Your Dynatrace Bill: How to Cut Observability Costs, Not Visibility
    Architecting for Value: A Playbook for Sustainable Observability
    How to Cut Observability Costs with Synthetic Monitoring and Responsive Pipelines
    Unlock Deeper Insights: Introducing GitLab Event Integration with Mezmo
    Introducing the New Mezmo Product Homepage
    The Inconvenient Truth About AI Ethics in Observability
    Observability's Moneyball Moment: How AI Is Changing the Game (Not Ending It)
    Do you Grok It?
    Top Five Reasons Telemetry Pipelines Should Be on Every Engineer’s Radar
    Is It a Cup or a Pot? Helping You Pinpoint the Problem—and Sleep Through the Night
    Smarter Telemetry Pipelines: The Key to Cutting Datadog Costs and Observability Chaos
    Why Datadog Falls Short for Log Management and What to Do Instead
    Telemetry for Modern Apps: Reducing MTTR with Smarter Signals
    Transforming Observability: Simpler, Smarter, and More Affordable Data Control
    Datadog: The Good, The Bad, The Costly
    Mezmo Recognized with 25 G2 Awards for Spring 2025
    Reducing Telemetry Toil with Rapid Pipelining
    Cut Costs, Not Insights:   A Practical Guide to Telemetry Data Optimization
    Webinar Recap: Telemetry Pipeline 101
    Petabyte Scale, Gigabyte Costs: Mezmo’s Evolution from ElasticSearch to Quickwit
    2024 Recap - Highlights of Mezmo’s product enhancements
    My Favorite Observability and DevOps Articles of 2024
    AWS re:Invent ‘24: Generative AI Observability, Platform Engineering, and 99.9995% Availability
    From Gartner IOCS 2024 Conference: AI, Observability Data, and Telemetry Pipelines
    Our team’s learnings from Kubecon: Use Exemplars, Configuring OTel, and OTTL cookbook
    How Mezmo Uses a Telemetry Pipeline to Handle Metrics, Part II
    Webinar Recap: 2024 DORA Report: Accelerate State of DevOps
    Kubecon ‘24 recap: Patent Trolls, OTel Lessons at Scale, and Principle Platform Abstractions
    Announcing Mezmo Flow: Build a Telemetry Pipeline in 15 minutes
    Key Takeaways from the 2024 DORA Report
    Webinar Recap | Telemetry Data Management: Tales from the Trenches
    What are SLOs/SLIs/SLAs?
    Webinar Recap | Next Gen Log Management: Maximize Log Value with Telemetry Pipelines
    Creating In-Stream Alerts for Telemetry Data
    Creating Re-Usable Components for Telemetry Pipelines
    Optimizing Data for Service Management Objective Monitoring
    More Value From Your Logs: Next Generation Log Management from Mezmo
    A Day in the Life of a Mezmo SRE
    Webinar Recap: Applying a Data Engineering Approach to Telemetry Data
    Dogfooding at Mezmo: How we used telemetry pipeline to reduce data volume
    Unlocking Business Insights with Telemetry Pipelines
    Why Your Telemetry (Observability) Pipelines Need to be Responsive
    How Data Profiling Can Reduce Burnout
    Data Optimization Technique: Route Data to Specialized Processing Chains
    Data Privacy Takeaways from Gartner Security & Risk Summit
    Mastering Telemetry Pipelines: Driving Compliance and Data Optimization
    A Recap of Gartner Security and Risk Summit: GenAI, Augmented Cybersecurity, Burnout
    Why Telemetry Pipelines Should Be A Part Of Your Compliance Strategy
    Pipeline Module: Event to Metric
    Telemetry Data Compliance Module
    OpenTelemetry: The Key To Unified Telemetry Data
    Data optimization technique: convert events to metrics
    What’s New With Mezmo: In-stream Alerting
    How Mezmo Used Telemetry Pipeline to Handle Metrics
    Webinar Recap: Mastering Telemetry Pipelines - A DevOps Lifecycle Approach to Data Management
    Open-source Telemetry Pipelines: An Overview
    SRECon Recap: Product Reliability, Burn Out, and more
    Webinar Recap: How to Manage Telemetry Data with Confidence
    Webinar Recap: Myths and Realities in Telemetry Data Handling
    Using Vector to Build a Telemetry Pipeline Solution
    Managing Telemetry Data Overflow in Kubernetes with Resource Quotas and Limits
    How To Optimize Telemetry Pipelines For Better Observability and Security
    Gartner IOCS Conference Recap: Monitoring and Observing Environments with Telemetry Pipelines
    AWS re:Invent 2023 highlights: Observability at Stripe, Capital One, and McDonald’s
    Webinar Recap: Best Practices for Observability Pipelines
    Introducing Responsive Pipelines from Mezmo
    My First KubeCon - Tales of the K8’s community, DE&I, sustainability, and OTel
    Modernize Telemetry Pipeline Management with Mezmo Pipeline as Code
    How To Profile and Optimize Telemetry Data: A Deep Dive
    Kubernetes Telemetry Data Optimization in Five Steps with Mezmo
    Introducing Mezmo Edge: A Secure Approach To Telemetry Data
    Understand Kubernetes Telemetry Data Immediately With Mezmo’s Welcome Pipeline
    Unearthing Gold: Deriving Metrics from Logs with Mezmo Telemetry Pipeline
    Webinar Recap: The Single Pane of Glass Myth
    Empower Observability Engineers: Enhance Engineering With Mezmo
    Webinar Recap: How to Get More Out of Your Log Data
    Unraveling the Log Data Explosion: New Market Research Shows Trends and Challenges
    Webinar Recap: Unlocking the Full Value of Telemetry Data
    Data-Driven Decision Making: Leveraging Metrics and Logs-to-Metrics Processors
    How To Configure The Mezmo Telemetry Pipeline
    Supercharge Elasticsearch Observability With Telemetry Pipelines
    Enhancing Grafana Observability With Telemetry Pipelines
    Optimizing Your Splunk Experience with Telemetry Pipelines
    Webinar Recap: Unlocking Business Performance with Telemetry Data
    Enhancing Datadog Observability with Telemetry Pipelines
    Transforming Your Data With Telemetry Pipelines