
The Mezmo newsroom
Browse by topic
AI & Agentic Operations
AI & Agentic Operations
Company Milestones & Recognition
Company Milestones & Recognition
DevOps & Security
DevOps & Security
Industry Research & Analyst Coverage
Industry Research & Analyst Coverage
Industry Voices
Industry Voices
Observability Cost Control
Observability Cost Control
OpenTelemetry
OpenTelemetry
Platform Observability & Kubernetes
Platform Observability & Kubernetes
Product Launches
Product Launches
Telemetry Pipeline
Telemetry Pipeline
Recent news
Unified observability drives a paradigm shift in Kubernetes monitoring for 2026
Unified observability drives a paradigm shift in Kubernetes monitoring for 2026

AURA - Mezmo's Open Source Agentic AI Play
AURA - Mezmo's Open Source Agentic AI Play

Why open source project AURA is critical in the AI era
Why open source project AURA is critical in the AI era

Why AI Agents Fail Quietly in Production
Why AI Agents Fail Quietly in Production

NightVision Interview Series with Mezmo CEO, Tucker Callaway
NightVision Interview Series with Mezmo CEO, Tucker Callaway

Making Data Agent Ready - an interview with Software Huddle
Making Data Agent Ready - an interview with Software Huddle
Introducing AURA: Building an Open Agentic harness for production AI
Introducing AURA: Building an Open Agentic harness for production AI
Why We Need an Open Source System of Context in the AI Era
Why We Need an Open Source System of Context in the AI Era
Agentic AI Foundation Welcomes 97 New Members As Demand for Open, Collaborative Agent Standardization Increases
Agentic AI Foundation Welcomes 97 New Members As Demand for Open, Collaborative Agent Standardization Increases
10 Software Companies to Watch in 2026
10 Software Companies to Watch in 2026
How Mezmo Cuts AI Observability Costs by 90% With Context Engineering | Tucker Callaway
How Mezmo Cuts AI Observability Costs by 90% With Context Engineering | Tucker Callaway
Code Story: Insights from Startup Tech Leaders with Mezmo's Tucker Callaway
Code Story: Insights from Startup Tech Leaders with Mezmo's Tucker Callaway
2026 Observability Predictions - Part 3
2026 Observability Predictions - Part 3
2026 Observability Predictions - Part 1
2026 Observability Predictions - Part 1
How AI-Driven Observability Is Transforming SRE: Insights from Mezmo CEO Tucker Callaway
How AI-Driven Observability Is Transforming SRE: Insights from Mezmo CEO Tucker Callaway
.png)
2026: The End of the Dashboard as We Know It?
2026: The End of the Dashboard as We Know It?
The Importance of Context Engineering in the AI Era
The Importance of Context Engineering in the AI Era

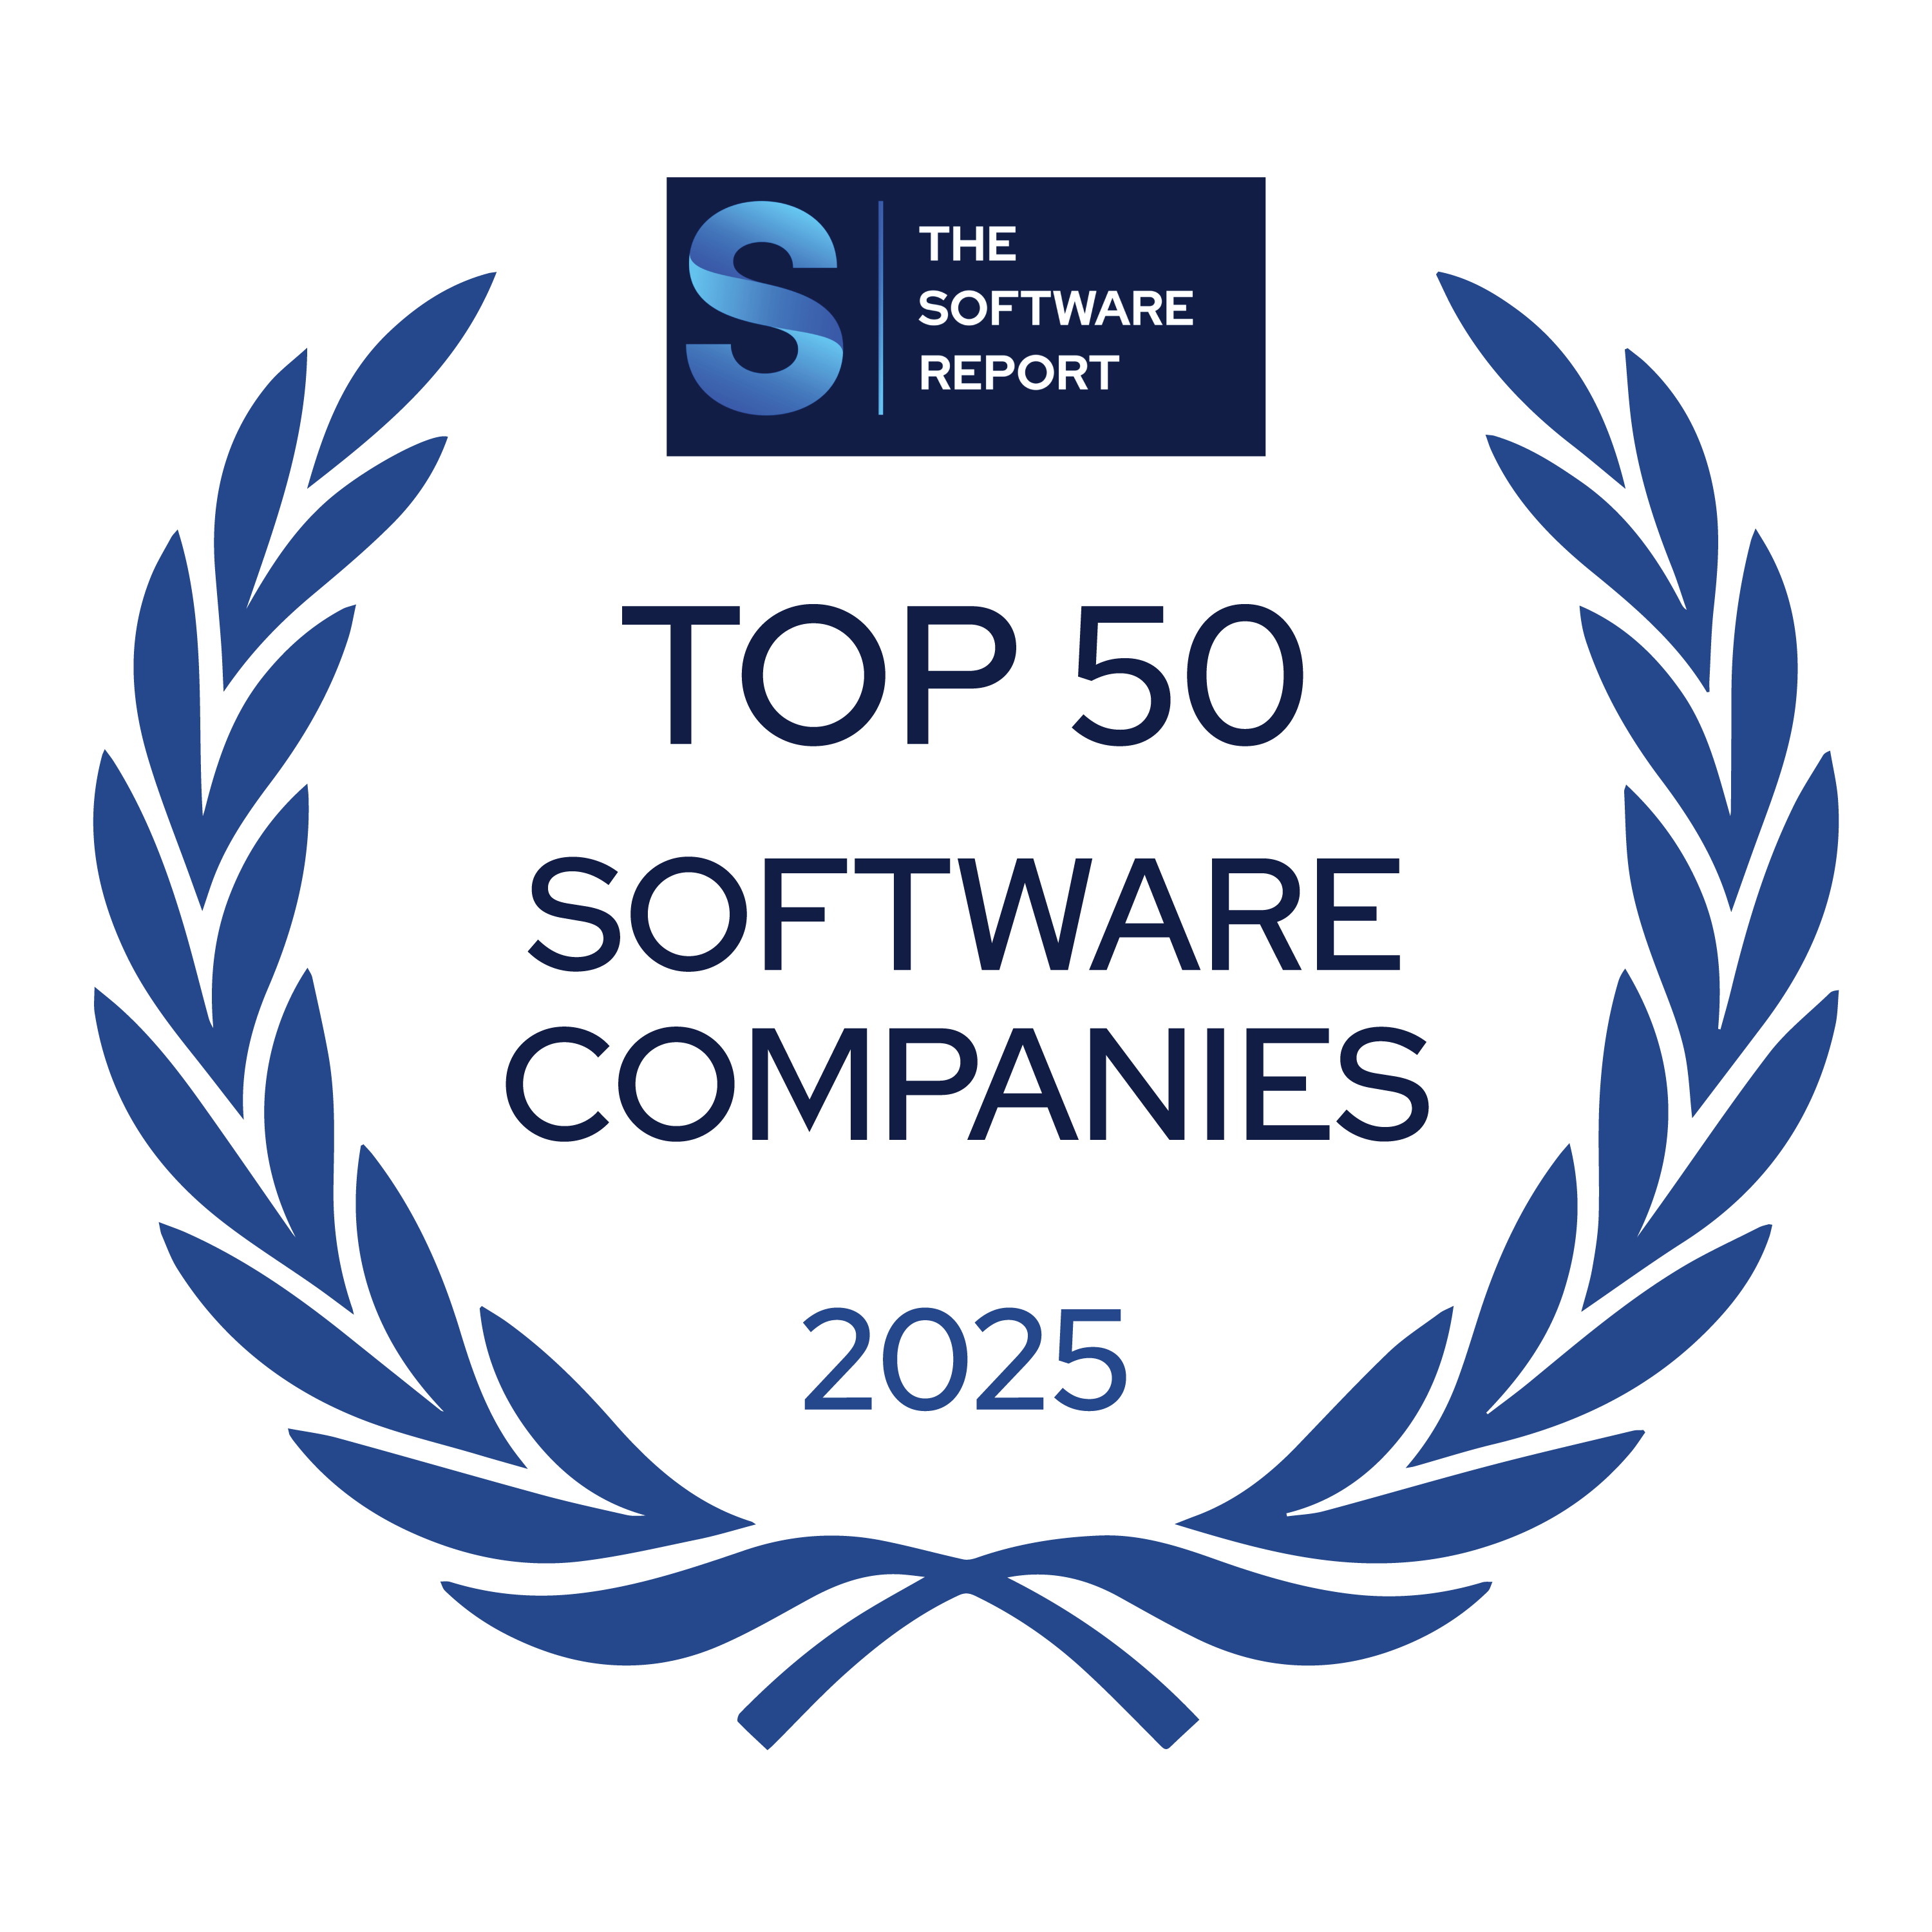
Mezmo: Named One of The Top 50 Software Companies of 2025
Mezmo: Named One of The Top 50 Software Companies of 2025
Why Synthetic Tracing Delivers Better Data, Not Just More Data
Why Synthetic Tracing Delivers Better Data, Not Just More Data
Why Agentic SREs Require Active Telemetry in Kubernetes
Why Agentic SREs Require Active Telemetry in Kubernetes

5 Startups Defining AI SRE
5 Startups Defining AI SRE
Mezmo Launches AI SRE Agent for Root Cause Analysis
Mezmo Launches AI SRE Agent for Root Cause Analysis
AI-Driven Observability with Tucker Callaway | The Software With Podcast
AI-Driven Observability with Tucker Callaway | The Software With Podcast
Mezmo CEO Tucker Callaway on Active Telemetry, Context Engineering, and the Fastest AI SRE for Kubernetes | 10KMedia Podcast
Mezmo CEO Tucker Callaway on Active Telemetry, Context Engineering, and the Fastest AI SRE for Kubernetes | 10KMedia Podcast

Mezmo Launches Fast & Precise AI SRE for Kubernetes Ahead of KubeCon
Mezmo Launches Fast & Precise AI SRE for Kubernetes Ahead of KubeCon
Mezmo Wins 2025 Digital Innovator Award from Intellyx
Mezmo Wins 2025 Digital Innovator Award from Intellyx

Mezmo Announces Cost Optimization Workflow to Reduce Observability Spend for Datadog Users
Mezmo Announces Cost Optimization Workflow to Reduce Observability Spend for Datadog Users

Mezmo Disrupts Market by Reducing Observability Cost Structure by 90%
Mezmo Disrupts Market by Reducing Observability Cost Structure by 90%
Building trust in telemetry data [Q&A]
Building trust in telemetry data [Q&A]

2025 Observability Predictions - Part 1
2025 Observability Predictions - Part 1
Mezmo Simplifies Management of Telemetry Data to Reduce Observability Costs
Mezmo Simplifies Management of Telemetry Data to Reduce Observability Costs
At KubeCon/CloudNativeCon 2024, AI hype gives way to real application concerns
At KubeCon/CloudNativeCon 2024, AI hype gives way to real application concerns
Mezmo Unveils Mezmo Flow for Guided Data Onboarding and One-Click Log Volume Optimization
Mezmo Unveils Mezmo Flow for Guided Data Onboarding and One-Click Log Volume Optimization
Mezmo Flow Released
Mezmo Flow Released
What’s new from KubeCon + Cloud Native Con North America 2024
What’s new from KubeCon + Cloud Native Con North America 2024

Mezmo Unveils Mezmo Flow for Guided Data Onboarding and One-Click Log Volume Optimization - Yahoo Finance
Mezmo Unveils Mezmo Flow for Guided Data Onboarding and One-Click Log Volume Optimization - Yahoo Finance

Real-time Analytics News for the Week Ending November 16
Real-time Analytics News for the Week Ending November 16

Analytics and Data Science News for the Week of November 15; Updates from Alteryx, DataRobot, ThoughtSpot & More
Analytics and Data Science News for the Week of November 15; Updates from Alteryx, DataRobot, ThoughtSpot & More

Modern Observability Through Application Development
Modern Observability Through Application Development
Mezmo CEO Tucker Callaway Shares Observability Insights and KubeCon + CloudNativeCon 2024 Plans
Mezmo CEO Tucker Callaway Shares Observability Insights and KubeCon + CloudNativeCon 2024 Plans
Telemetry Data: The Puzzle Pieces of Observability
Telemetry Data: The Puzzle Pieces of Observability

Q&A with Tucker Callaway, CEO of Mezmo
Q&A with Tucker Callaway, CEO of Mezmo

Mezmo Makes Inc. 5000’s List of Fastest Growing Companies in the Nation for Third Consecutive Year
Mezmo Makes Inc. 5000’s List of Fastest Growing Companies in the Nation for Third Consecutive Year
7 Ways Telemetry Pipelines Unlock Data Confidence
7 Ways Telemetry Pipelines Unlock Data Confidence
The 2024 SD Times 100: 'Best in Show' in Software Development
The 2024 SD Times 100: 'Best in Show' in Software Development

Mezmo Hires Former StackHawk, New Relic Leader as Vice President of Product
Mezmo Hires Former StackHawk, New Relic Leader as Vice President of Product
Inside the VP of Sales' Journey: Financial Software to AI Startups - Craig McAndrews Spills it all!
Inside the VP of Sales' Journey: Financial Software to AI Startups - Craig McAndrews Spills it all!

Mezmo: Adding In-Stream Alert Capabilities to Telemetry Pipeline Platform
Mezmo: Adding In-Stream Alert Capabilities to Telemetry Pipeline Platform

An IT Manager's (Re)View of the RSA Conference
An IT Manager's (Re)View of the RSA Conference

Real-time Analytics News for the Week Ending May 11
Real-time Analytics News for the Week Ending May 11

Mezmo Adds Industry-First Stateful Processing in Telemetry Pipelines
Mezmo Adds Industry-First Stateful Processing in Telemetry Pipelines
SalesTechStar Interview with Craig McAndrews, Vice President of Sales at Mezmo
SalesTechStar Interview with Craig McAndrews, Vice President of Sales at Mezmo

Mezmo Ranks No. 82 on Inc. Magazine’s List of the Pacific Region’s Fastest-Growing Private Companies
Mezmo Ranks No. 82 on Inc. Magazine’s List of the Pacific Region’s Fastest-Growing Private Companies
How To Break Down Silos To Get More Benefit From Your Data
How To Break Down Silos To Get More Benefit From Your Data
Mezmo Bolsters Sales Leadership With New Hires From Chef and Apptio
Mezmo Bolsters Sales Leadership With New Hires From Chef and Apptio
How Metric Normalization Enhances Data Observability
How Metric Normalization Enhances Data Observability
KubeCon 2023: Telemetry and Data Management
KubeCon 2023: Telemetry and Data Management

Telemetry Data’s Role in Cybersecurity – Tucker Callaway – Enterprise Security Weekly
Telemetry Data’s Role in Cybersecurity – Tucker Callaway – Enterprise Security Weekly

Breaking data silos between observability and security empowers organizations
Breaking data silos between observability and security empowers organizations

2024 Application Performance Management Predictions - Part 3: Observability
2024 Application Performance Management Predictions - Part 3: Observability
Data Management News for the Week of November 10; Updates from AWS, Monte Carlo, Satori & More
Data Management News for the Week of November 10; Updates from AWS, Monte Carlo, Satori & More

Real-time Analytics News for the Week Ending November 11
Real-time Analytics News for the Week Ending November 11
At KubeCon NA 2023, finding cloud independence on the edges of Kubernetes
At KubeCon NA 2023, finding cloud independence on the edges of Kubernetes

Mezmo Introduces Data Profiling and Responsive Telemetry Pipelines for Kubernetes
Mezmo Introduces Data Profiling and Responsive Telemetry Pipelines for Kubernetes
KubeCon: GKE Enterprise gets release date, Mezmo adds data profiling feature, and more
KubeCon: GKE Enterprise gets release date, Mezmo adds data profiling feature, and more

Data Profiling & Responsive Telemetry Pipelines For Kubernetes | Mezmo
Data Profiling & Responsive Telemetry Pipelines For Kubernetes | Mezmo
Optimize Your Observability Spending in 5 Steps
Optimize Your Observability Spending in 5 Steps

Take Control of Your Kubernetes Telemetry Data
Take Control of Your Kubernetes Telemetry Data
The Role of Observability Engineers in Managing Complex IT Systems
The Role of Observability Engineers in Managing Complex IT Systems

Mezmo Launches Welcome Pipeline to Unlock Kubernetes Insights Faster
Mezmo Launches Welcome Pipeline to Unlock Kubernetes Insights Faster
Mezmo Ranks #1,386 on Inc. 5000’s List of Fastest Growing Companies in the Nation
Mezmo Ranks #1,386 on Inc. 5000’s List of Fastest Growing Companies in the Nation
Mezmo Simplifies Management of DevOps Telemetry Data
Mezmo Simplifies Management of DevOps Telemetry Data
Mezmo Empowers Enterprises to Extract Business Insights from Telemetry Data
Mezmo Empowers Enterprises to Extract Business Insights from Telemetry Data
How DevOps Teams Can Manage Telemetry Data Complexity
How DevOps Teams Can Manage Telemetry Data Complexity

Mezmo Wins the 2023 Digital Innovator Award from Intellyx
Mezmo Wins the 2023 Digital Innovator Award from Intellyx

Tucker Callaway, Mezmo | RSA Conference 2023
Tucker Callaway, Mezmo | RSA Conference 2023

Mezmo: Cloud Native Telemetry Pipeline
Mezmo: Cloud Native Telemetry Pipeline
Mezmo Adds Free Community Plan for Managing Observability Data
Mezmo Adds Free Community Plan for Managing Observability Data
Mezmo Announces Free Access to Telemetry Pipeline
Mezmo Announces Free Access to Telemetry Pipeline
Tame Telemetry Data With Mezmo Observability Pipeline
Tame Telemetry Data With Mezmo Observability Pipeline

Mezmo Named 2023 Log Analytics Solution of the Year In Data Breakthrough Awards
Mezmo Named 2023 Log Analytics Solution of the Year In Data Breakthrough Awards
Down the Observability Pipeline with Mezmo
Down the Observability Pipeline with Mezmo

How Developers, SRE Teams, and Security Engineers Use Telemetry Data
How Developers, SRE Teams, and Security Engineers Use Telemetry Data

Data Pipeline Feeds IT's Observability Beast
Data Pipeline Feeds IT's Observability Beast

How to Maximize Telemetry Data Value With Observability Pipelines
How to Maximize Telemetry Data Value With Observability Pipelines

Mezmo Ranks #53 on Inc. Magazine’s List of Fastest-Growing Companies in the Pacific Region
Mezmo Ranks #53 on Inc. Magazine’s List of Fastest-Growing Companies in the Pacific Region
Mezmo 2023 Predictions: More Organizations Adopt OpenTelemetry
Mezmo 2023 Predictions: More Organizations Adopt OpenTelemetry

Understanding Observability Data's Impact Across an Organization
Understanding Observability Data's Impact Across an Organization
Solutions Review Names 6 Data Observability Vendors to Watch, 2023
Solutions Review Names 6 Data Observability Vendors to Watch, 2023

DevSecOps Accelerates Incident Detection, Response Efforts
DevSecOps Accelerates Incident Detection, Response Efforts

2023 Application Performance Management Predictions - Part 3
2023 Application Performance Management Predictions - Part 3
Mezmo-Harris Poll Report Explores the Impact of Observability Data
Mezmo-Harris Poll Report Explores the Impact of Observability Data
Mezmo Wins Intellyx 2022 Digital Innovator Award
Mezmo Wins Intellyx 2022 Digital Innovator Award

Mezmo Ranked No. 164 on Deloitte Technology Fast 500
Mezmo Ranked No. 164 on Deloitte Technology Fast 500
Mezmo Wins 2022 Reworked IMPACT Award
Mezmo Wins 2022 Reworked IMPACT Award
Mezmo Unveils Observability Pipeline to Enhance the Value of Data
Mezmo Unveils Observability Pipeline to Enhance the Value of Data
Launching a podcast? Try these 14 tips for greater exposure
Launching a podcast? Try these 14 tips for greater exposure

DevSecOps Expedites Incident Detection and Response Time
DevSecOps Expedites Incident Detection and Response Time
Mezmo Named A Fastest Growing Company On Inc. 5000
Mezmo Named A Fastest Growing Company On Inc. 5000

