Beyond the Pipeline: Data Isn't Oil, It's Power.
Originally published on Medium, this piece by Winston Hearn dives into a philosophical discussion on why the "data is oil" metaphor is no longer serving the tech industry. Hearn argues that by reframing our thinking to "data is power," we can better understand and manage today's complex data systems.
For more than a decade, we in the tech industry have referenced a common metaphor: data is the new oil. It’s a concept that’s easy to grasp. It paints a picture of a raw, valuable resource waiting to be extracted, refined, and transported. This metaphor naturally led us to another one, a concept that's been central to our industry and even how we've named products here at Mezmo: the data pipeline.
It’s a neat story. But as I’ve been digging into the observability space, particularly around OpenTelemetry, I’ve hit a wall. A nagging feeling that this metaphor, as useful as it has been, is now holding us back. It doesn't accurately describe the world we live in or the complex systems we're trying to build and manage. Now, at Mezmo, we believe evolving beyond this metaphor is critical to unlocking the true value of telemetry data.
So, I want to propose a new metaphor, a new way to frame the problem. It’s a bit of a shift, but I believe it brings immense clarity to the challenges SREs and developers face every day.
Data is not oil. Data is power.

Specifically, it’s electrical power. It’s a commodity that runs our modern world, often invisible but absolutely essential. And if we start thinking about data as power, then our "pipelines" start looking a lot more like what they truly are: a dynamic, interconnected grid.
Where the Oil Metaphor Springs a Leak
Let's be candid. The "data as oil" analogy breaks down as soon as you look closely at the data lifecycle in 2025.
- Production: We don’t “drill” for data anymore. We’re drowning in it. Data isn’t a latent resource sitting in a reservoir; it’s a constant, active byproduct of every application, service, and user interaction. Much like a power plant generates electricity from an activity, our services generate data.
- Processing: Raw crude oil is mostly useless. It must be refined. Raw data, on the other hand, can be immediately useful — just tail -f a log file. More importantly, data isn’t ever refined into some end commodity. It’s transformed. We enrich it, reshape it, add context, and change its very nature as it moves (through aggregation and sampling). This is less like refining oil and more like stepping voltage up or down in a transformer to prepare electricity for long-distance travel or local consumption.
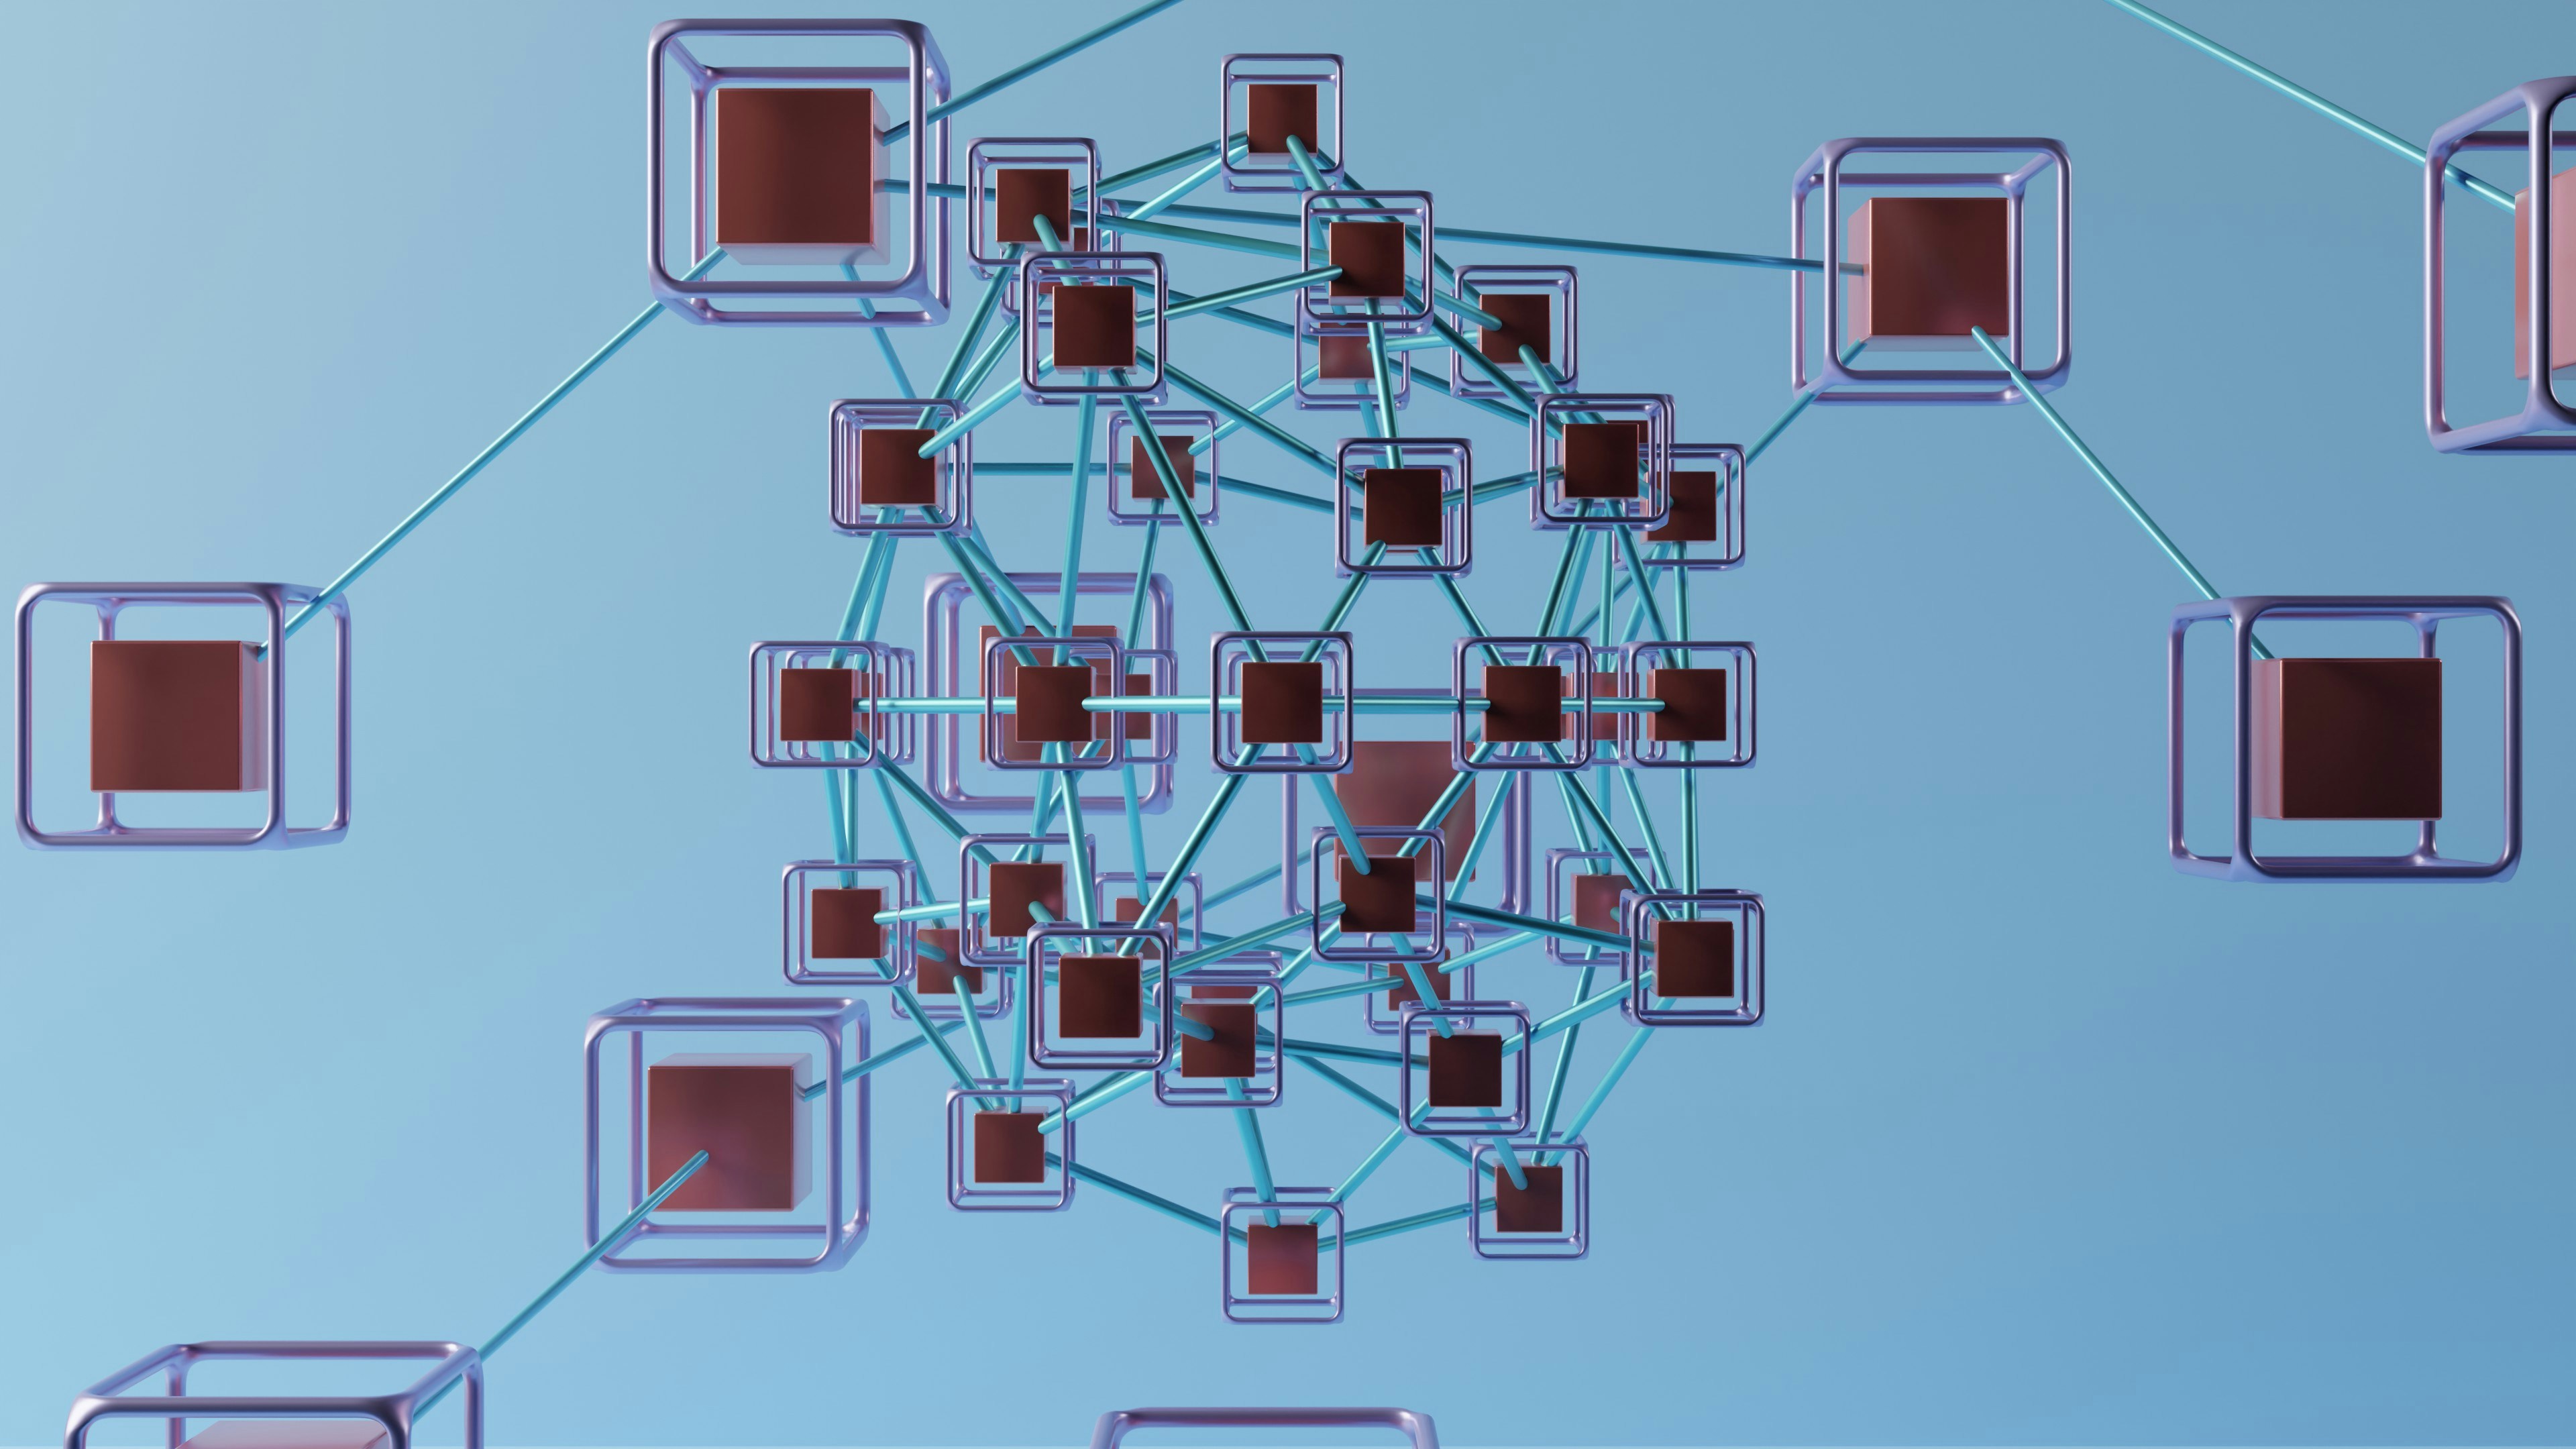
- Transmission: This is the heart of the issue. An oil pipeline is a brute-force piece of infrastructure. It’s a big, dumb pipe designed to move a single, homogenous substance from point A to point B. Is that really what your data infrastructure looks like? Of course not. Your data is dynamic and disparate. Some of it is critical, some is trivial. You route it, sample it, and enrich it mid-flight. That isn’t a pipeline; it’s an electrical grid — a resilient, flexible, and intelligent network.
- Consumption: Once oil is used, its journey is largely over. For data, arriving at a destination is often just the beginning. It’s not an inert product; it’s a dynamic source of ongoing insight, fueling dashboards, alerts, and countless new questions (and sometimes new problems).
.jpeg)
The Key Insight: Static Pipelines vs. Dynamic Grids
This isn't just a semantic argument. It's about understanding the nature of the infrastructure we need to build.
A pipeline is something you design, build, and then occasionally maintain. It's stable infrastructure.
A power grid is dynamic infrastructure. It's never "done." The entire system is a massive, real-time feedback loop.
Managing modern data requires dynamic infrastructure. The pipeline metaphor leads us to think in terms of fixed requirements and static designs. The power grid metaphor forces us to focus on what actually matters: continuous feedback, overall system capacity, and ever-changing requirements. This is the perspective that drives our product development at Mezmo.
Life on the Data Grid: What SREs and Developers Need
So, if we embrace this new model, what does it mean to build and operate a "Data Grid"? It means building for the people who live on this grid every day.
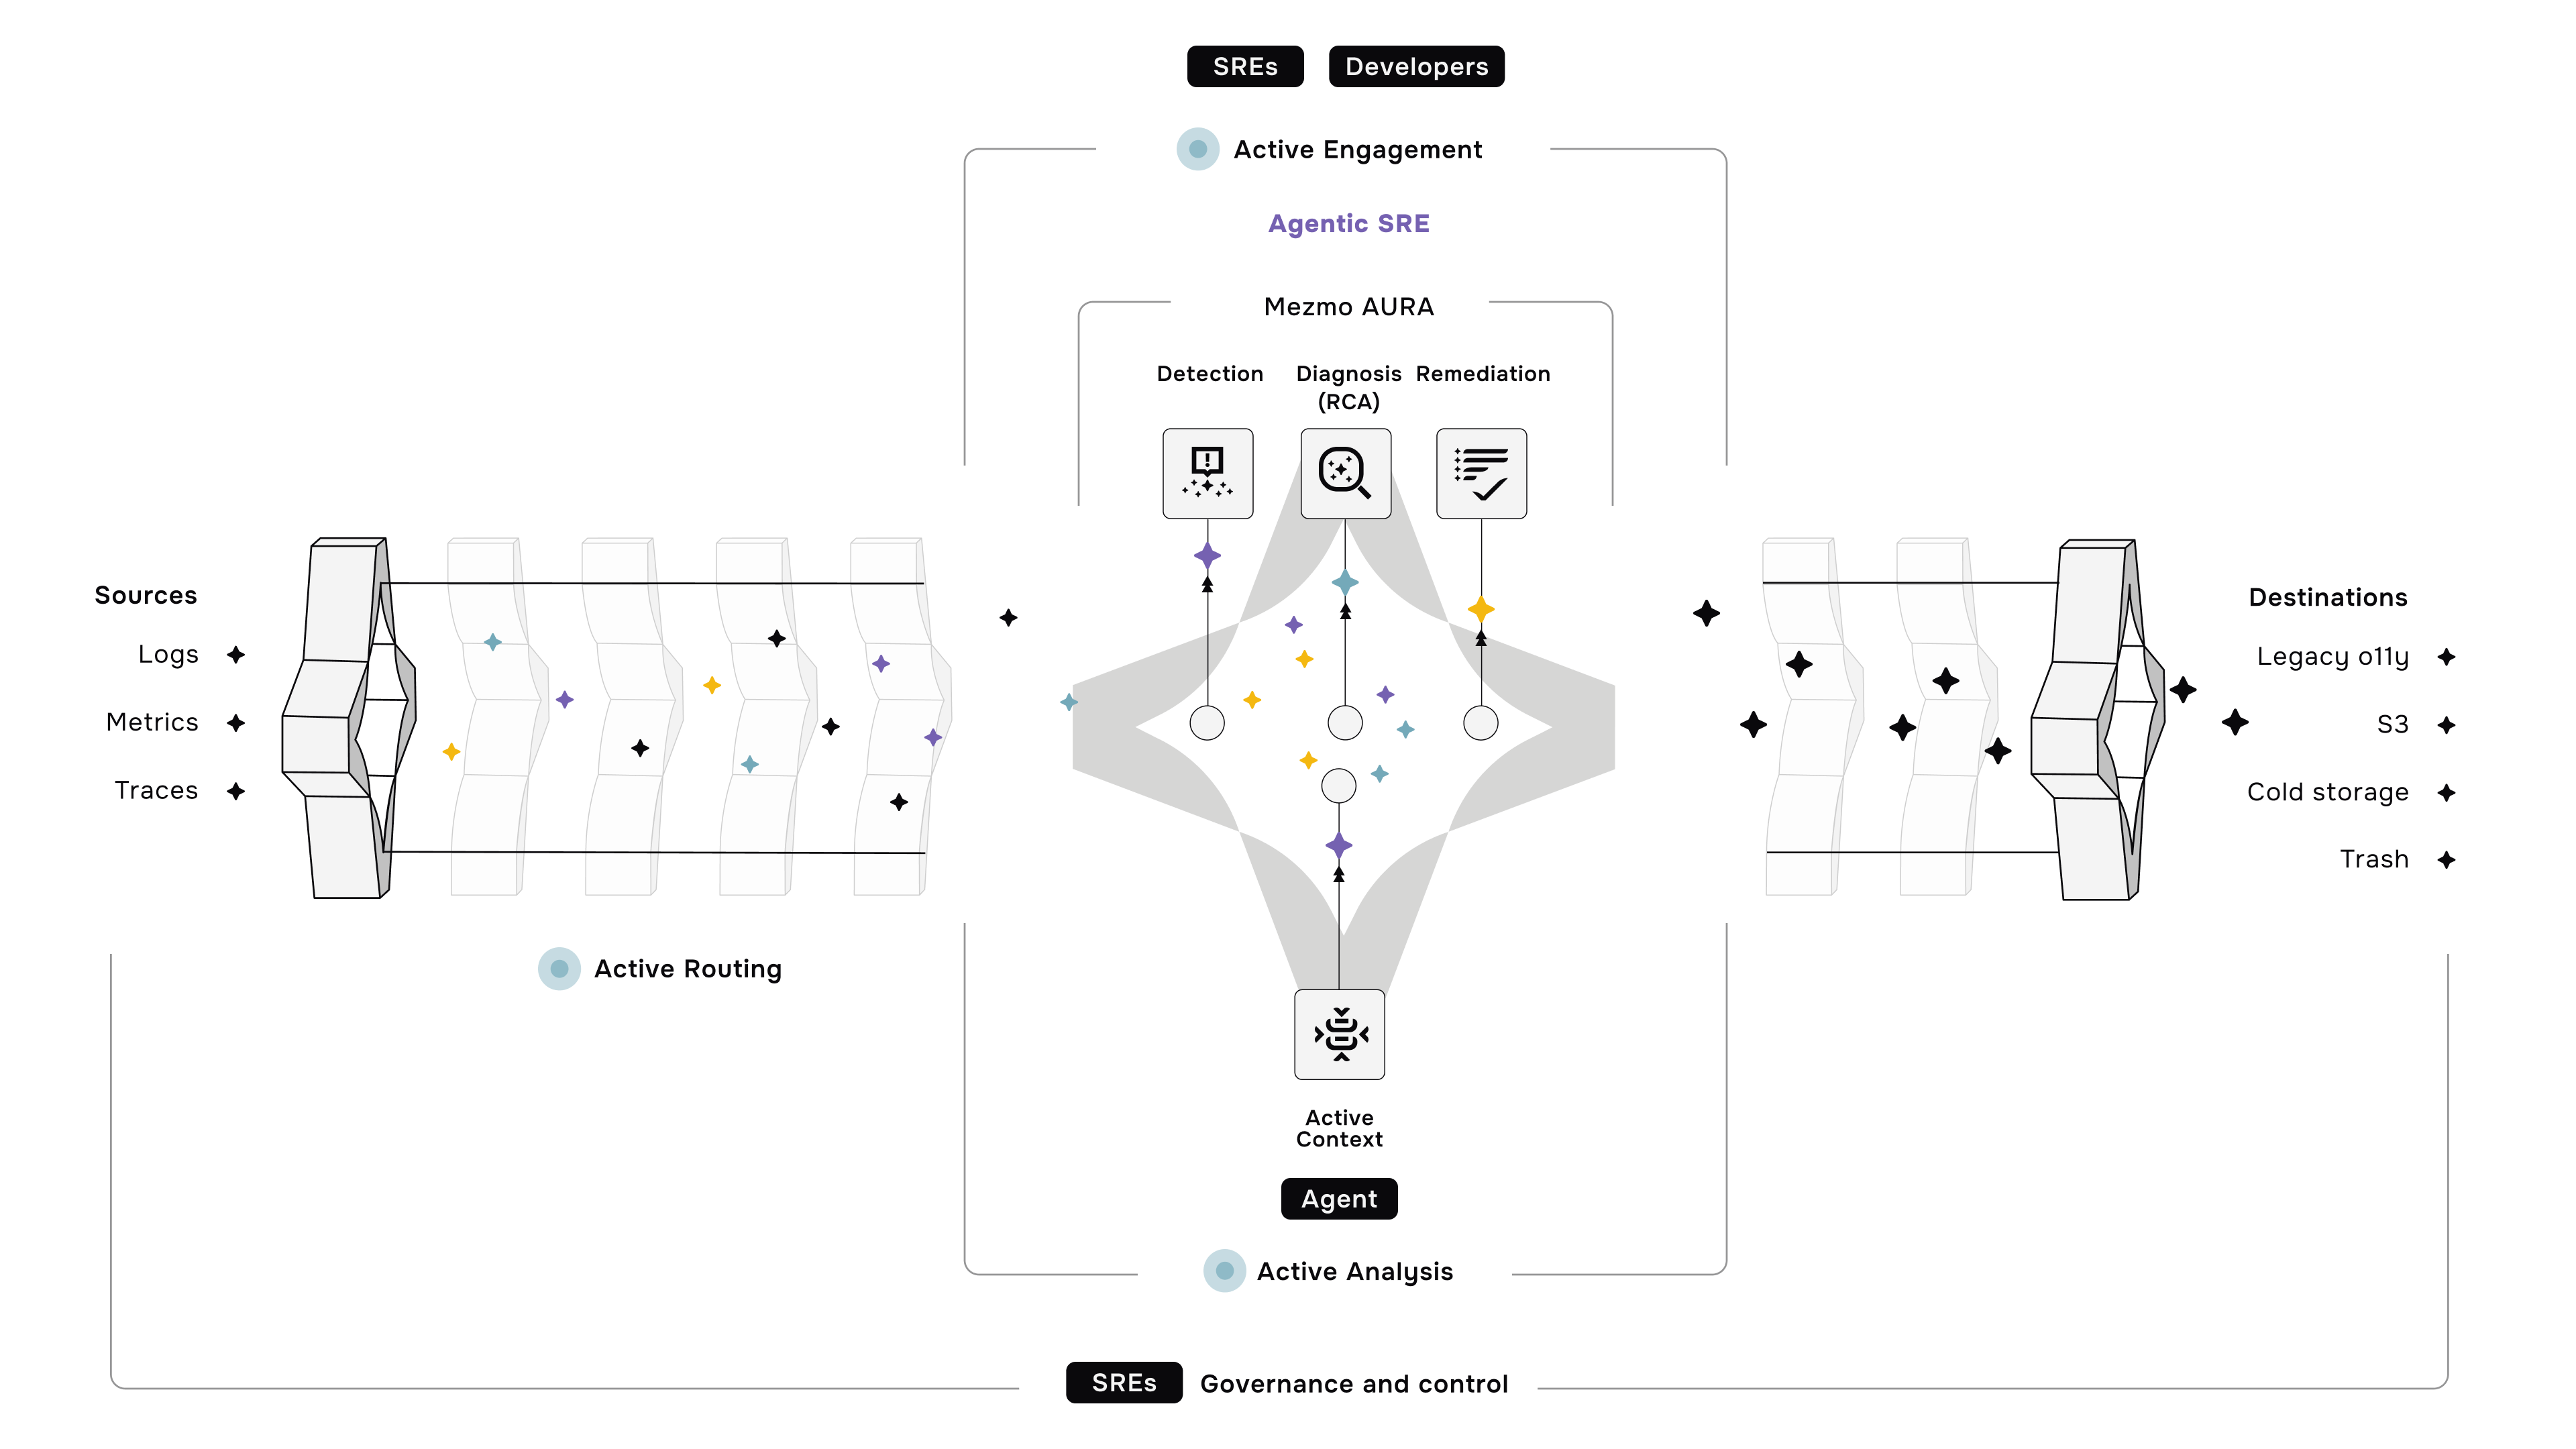
For SREs (The Grid Operators): You’re tasked with the stability and efficiency of the entire system. You’re not just laying pipe; you're managing the grid. You need a control room for your data, with visibility into capacity, interoperability, and cost.
For Developers (The Producers and Consumers): You're building services and using data to understand them. You need the agency to manage your data streams without becoming a systems expert or risking the stability of the entire grid. You need a safe, standardized "outlet" to plug into.
Mezmo's Data Grid Philosophy
Adopting this mindset clarifies what a modern data management platform must provide. It’s not about building a bigger pipeline; it's about providing the tools to architect a sophisticated grid focused on standards and real-time responsiveness.
Global Standardization: A power grid only works because of standards. For data, this means programmatic standardization. This is precisely what we're building with Mezmo's processing capabilities—a suite of "data transformers" that can reliably take data of any shape, conform it to a standard like OTel, and ensure it can be routed and processed predictably. Mezmo acts as the standardization layer, turning a chaotic mess of inputs into a manageable, interoperable system without forcing a massive re-instrumentation effort.
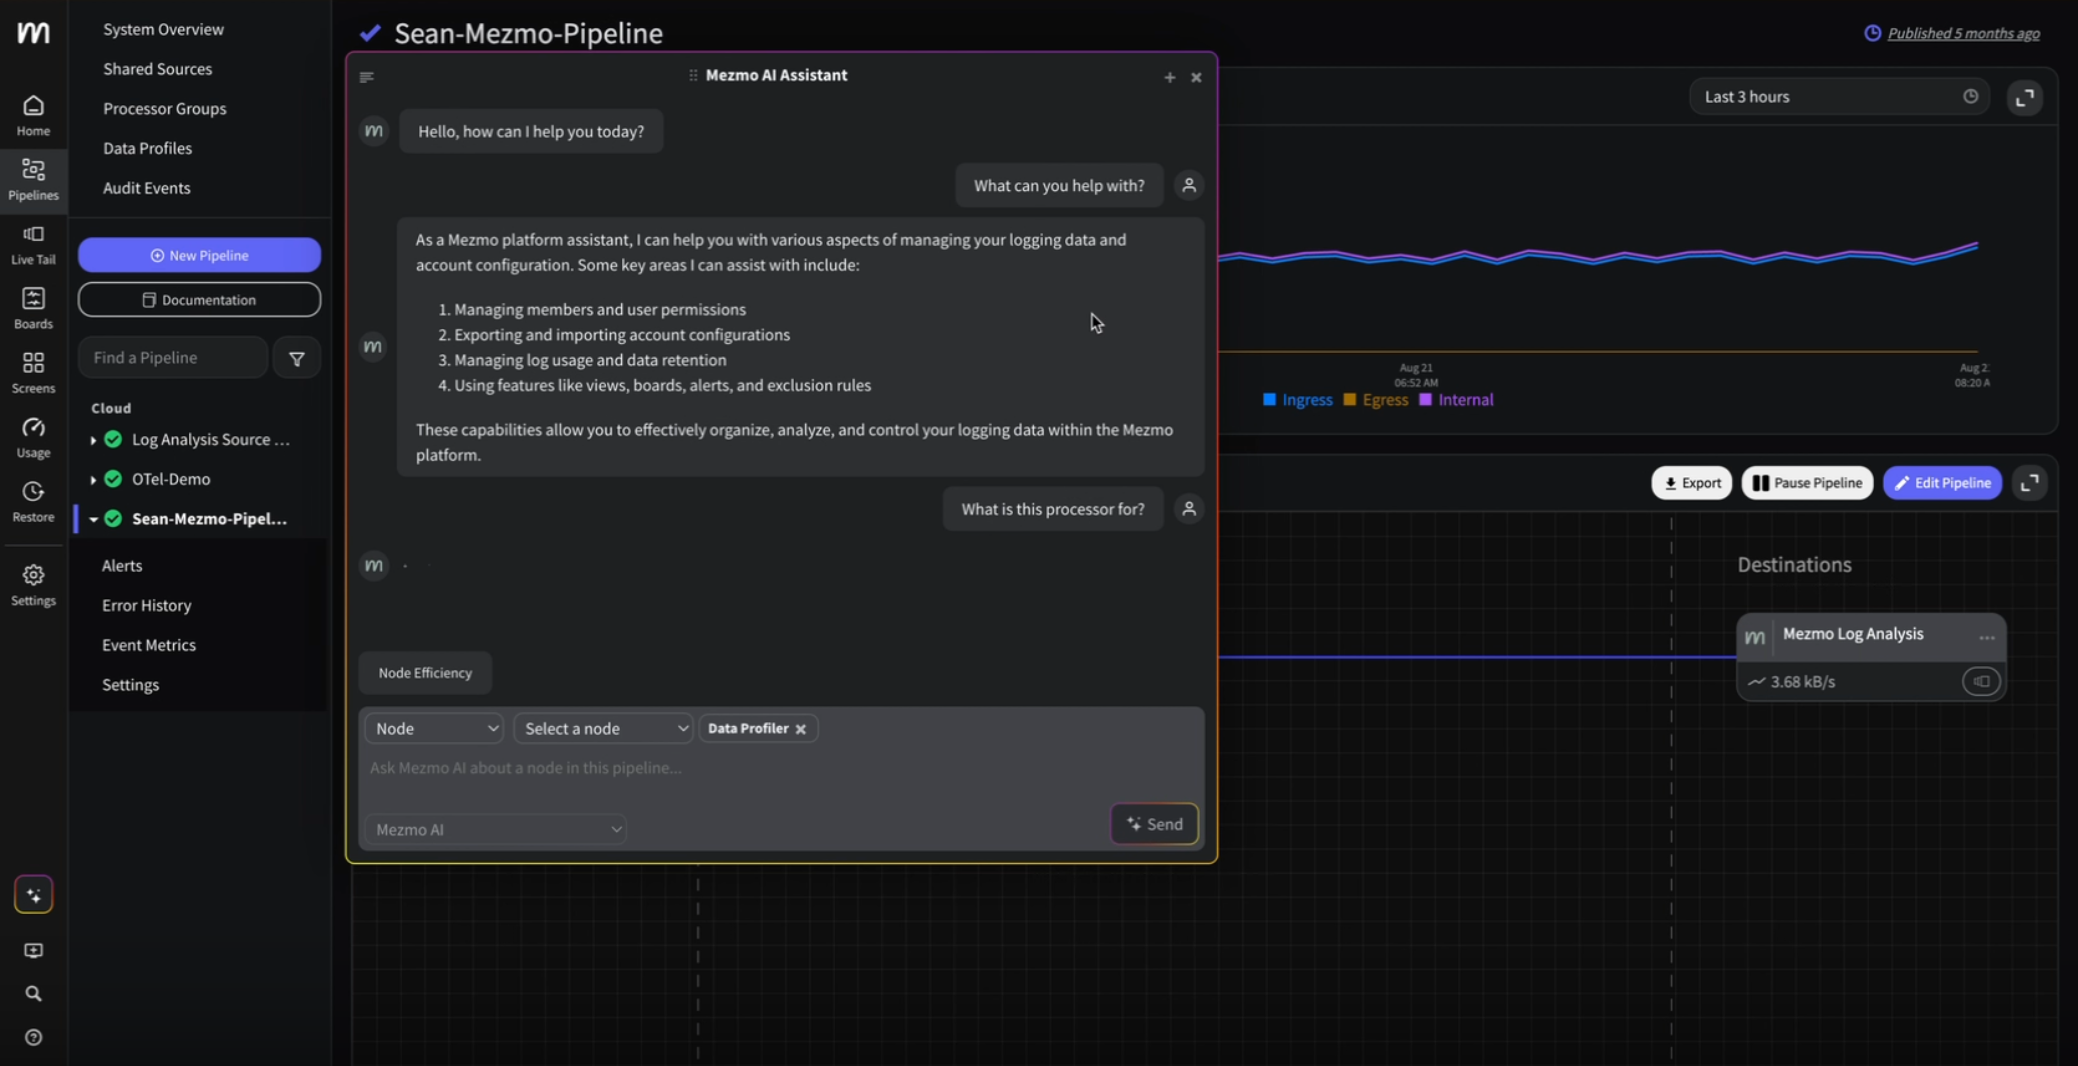
Transparency and Responsiveness: We need to build "Smart Grids" for data. This is why features like Pipeline Observability and real-time data profiling are first-class citizens in the Mezmo platform. You can't manage a dynamic grid if you can't see it. Mezmo provides that real-time visibility into data volume, cost, and shape at any point in the grid, enabling the feedback loops necessary to make intelligent decisions, like dynamically adjusting sampling based on error rates or cost thresholds.
Standardized Outputs: The part of an electrical grid that most of us encounter the most is its output: the electrical plug. Mezmo’s platform functions the same for your data; it’s easy to connect to any usage you have in mind, whether it’s an existing vendor for analysis, a new one teams are trialing, or your own storage to reduce costs. Pipelines handle all the work of managing volume, conforming to standards, and routing, so that dev teams need only connect their data to the desired destination, and immediately they are up and running, just like plugging in a device to an outlet.
This has been a bit of a philosophical journey, but I’m convinced that the metaphors we use shape the solutions we build. The "data as oil" story has served its purpose. To build the resilient, responsive, and observable systems required today, we need to move beyond the pipeline and start architecting the grid.
This is the future we're building towards at Mezmo. If you're tired of the constraints of a rigid pipeline and are ready to take control of your dynamic data grid, you're thinking like us.
Check out Mezmo with a 30-day free trial here.


.png)


.jpg)






.png)





.png)


