From Alert to Answer in Seconds: Accelerating Incident Response in Dynatrace

4 MIN READ
MIN READ

It is 12PM and you just start eating lunch when your phone starts buzzing. A storm of different monitoring and system-level alerts start stacking up on your phone and slack. The incident response "war room" opens and downtime communications are being drafted to customers. Your team is under pressure to find the root cause, but you are immediately hit with roadblocks. You try to make sense of the noise, by sifting through volumes of logs in Dynatrace, only to wait minutes--or hours--for critical diagnostic data to be rehydrated from a cold storage archive like S3. 

During an incident, nothing is more important than timely access to accurate information. Engineers don't need more data; they need the right data that provides a clear, targeted view into what’s going wrong. Every second spent searching for context or waiting for a data pipeline is a second added to your Mean Time to Resolution (MTTR).

This leads directly to the "cost vs. context" paradox. As we discussed in our last post, controlling costs often means filtering out verbose, high-volume data. But during an incident, that filtered data might contain the one clue needed to solve the problem. How can you have both aggressive cost savings and complete visibility when it matters most?

The Solution: The Risk-Free Way to Troubleshoot

Mezmo solves this paradox by giving you on-demand access to full-fidelity raw data, precisely when you need it, without the cost of storing it all long-term.

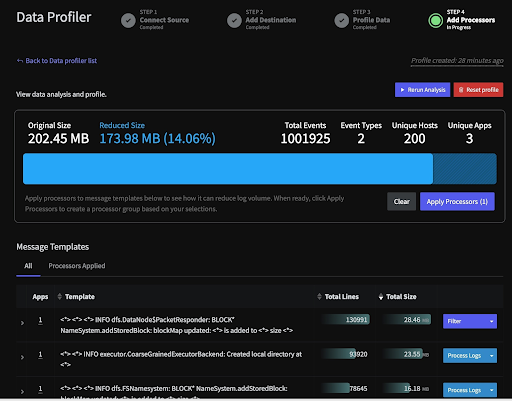
Automatically Generate a Cheat Sheet with Data Profiler

Developers that are on-call need to understand issues fast. Data Profiler can show you where the smoking gun is while reducing any noise not directly tied to the root cause issue. It can even be triggered automatically, as soon as the issue is detected, so the information is ready as soon as you are. 

Mezmo's Data Profiler

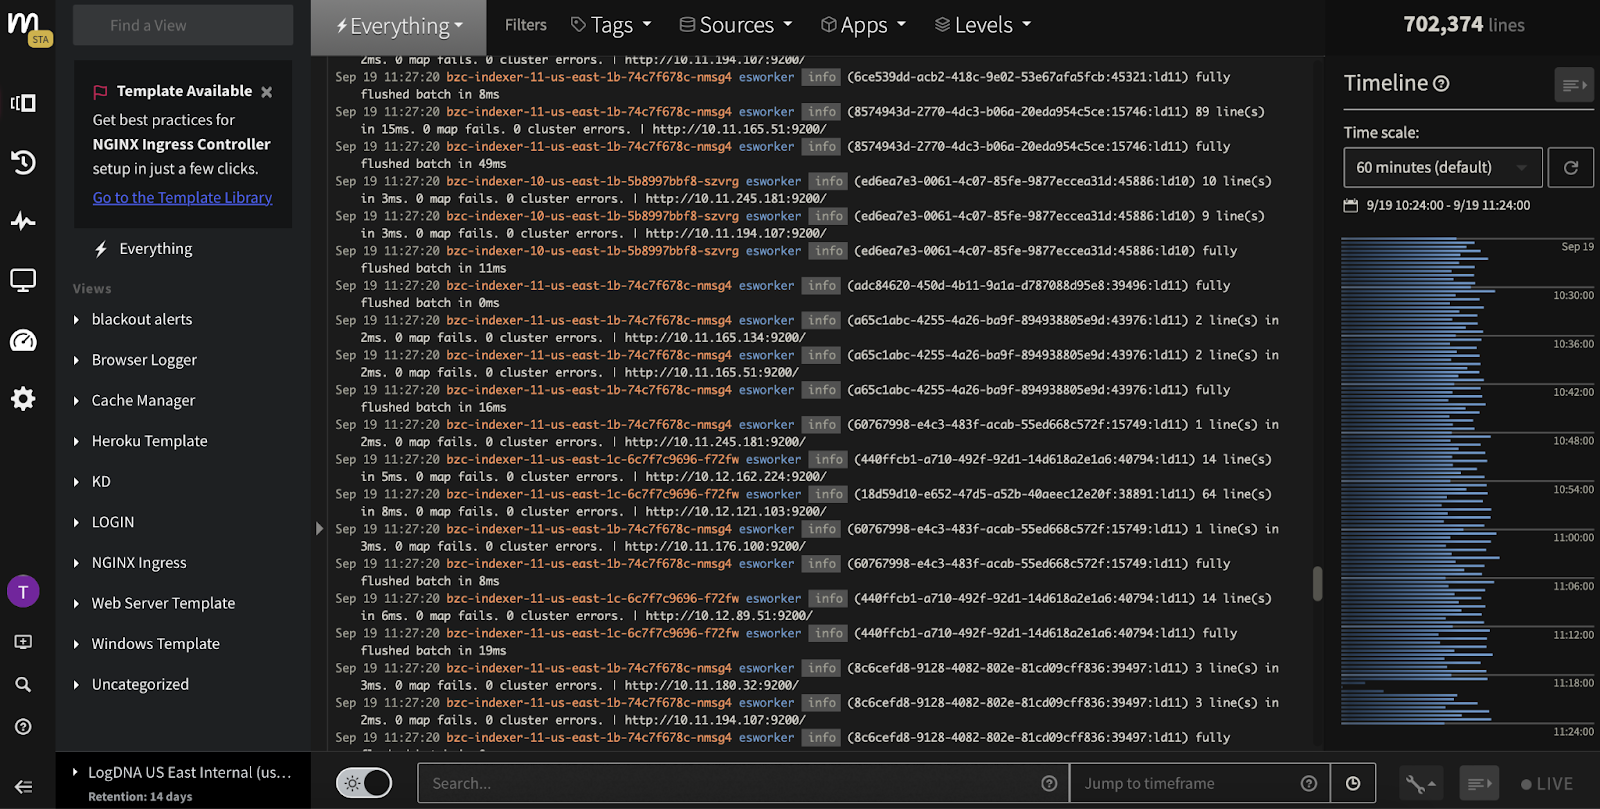
Find the Signal in Real-Time with Live Tail

During a high-stakes incident, you can't afford to wait for data to be indexed by Dynatrace. Mezmo's Live Tail lets your engineers view the raw log and event stream in real-time, before it hits any platform. This allows them to see what’s happening at the exact moment it occurs, finding the root cause in seconds, not minutes.

Mezmo's Live Tail

Accelerate Analysis with MCP

For developers who need real-time analysis, the Mezmo Context Provider (MCP) offers another powerful path to answers. Our hosted MCP server provides a direct endpoint for your AI tools, letting you run advanced root-cause analysis on recent logs using natural language, all without leaving your workspace, while also serving as the engine for our upcoming automated incident response features. 

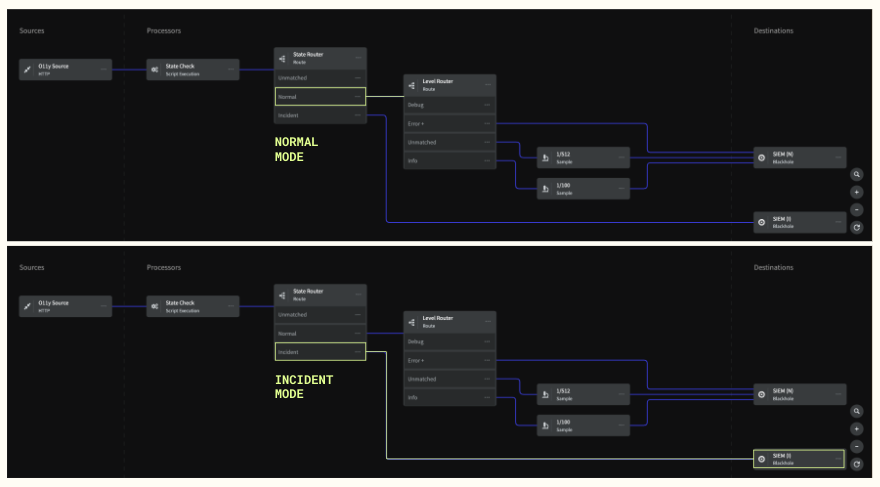
The Ultimate Safety Net: Responsive Pipelines & Replay

This is where Mezmo’s architecture becomes a game-changer. Even while you're filtering, aggregating, and sampling data to control costs, Mezmo's Responsive Pipelines automatically keep a short-term, full-fidelity replay buffer of all your raw data (e.g., the last 8 hours). When an incident is detected—perhaps by a Dynatrace alert—you can instantly "replay" that raw, high-context data directly into Dynatrace for deep analysis. No rehydration delays. No frantic searching. You get 100% of the context, on-demand, without paying to store it 24/7. This makes aggressive filtering and sampling completely risk-free.

Mezmo's Replay Buffer and Response Pipelines

Guarantee Capture of Error Traces

With Tail-Based Sampling, you can be confident that you’re eliminating noise, not critical signals. Mezmo guarantees 100% capture of important traces containing errors or high latency, ensuring your engineers always have the context they need to troubleshoot the most difficult problems.

Better Together: An Automated Incident Workflow

Imagine this workflow:

  1. Dynatrace's Davis AI detects an anomaly and fires an alert.
  2. A webhook from Dynatrace automatically triggers Mezmo's Responsive Pipeline to switch into "incident mode."
  3. Mezmo instantly replays the full-fidelity data from the minutes surrounding the alert directly into Dynatrace.
  4. Your engineers arrive at the incident with the exact, high-context data they need, ready for analysis.

This powerful integration means your team isn't digging for data; they're diagnosing the problem.

Conclusion

Stop letting data latency and availability slow down your incident response. By combining Mezmo's real-time troubleshooting and on-demand replay capabilities with Dynatrace's powerful analytics, you can dramatically reduce your MTTR, eliminate context-switching for your engineers, and diagnose and fix problems faster. And most importantly, eliminate those darn lunch disruptions so you can enjoy that sandwich.

Start your 30-day free trial of Mezmo here

Table of Contents

    Share Article

    RSS Feed

    Next blog post
    You're viewing our latest blog post.
    Previous blog post
    You're viewing our oldest blog post.
    Mezmo + Catchpoint deliver observability SREs can rely on
    Mezmo’s AI-powered Site Reliability Engineering (SRE) agent for Root Cause Analysis (RCA)
    What is Active Telemetry
    Launching an agentic SRE for root cause analysis
    Paving the way for a new era: Mezmo's Active Telemetry
    The Answer to SRE Agent Failures: Context Engineering
    Empowering an MCP server with a telemetry pipeline
    The Debugging Bottleneck: A Manual Log-Sifting Expedition
    The Smartest Member of Your Developer Ecosystem: Introducing the Mezmo MCP Server
    Your New AI Assistant for a Smarter Workflow
    The Observability Problem Isn't Data Volume Anymore—It's Context
    Beyond the Pipeline: Data Isn't Oil, It's Power.
    The Platform Engineer's Playbook: Mastering OpenTelemetry & Compliance with Mezmo and Dynatrace
    From Alert to Answer in Seconds: Accelerating Incident Response in Dynatrace
    Taming Your Dynatrace Bill: How to Cut Observability Costs, Not Visibility
    Architecting for Value: A Playbook for Sustainable Observability
    How to Cut Observability Costs with Synthetic Monitoring and Responsive Pipelines
    Unlock Deeper Insights: Introducing GitLab Event Integration with Mezmo
    Introducing the New Mezmo Product Homepage
    The Inconvenient Truth About AI Ethics in Observability
    Observability's Moneyball Moment: How AI Is Changing the Game (Not Ending It)
    Do you Grok It?
    Top Five Reasons Telemetry Pipelines Should Be on Every Engineer’s Radar
    Is It a Cup or a Pot? Helping You Pinpoint the Problem—and Sleep Through the Night
    Smarter Telemetry Pipelines: The Key to Cutting Datadog Costs and Observability Chaos
    Why Datadog Falls Short for Log Management and What to Do Instead
    Telemetry for Modern Apps: Reducing MTTR with Smarter Signals
    Transforming Observability: Simpler, Smarter, and More Affordable Data Control
    Datadog: The Good, The Bad, The Costly
    Mezmo Recognized with 25 G2 Awards for Spring 2025
    Reducing Telemetry Toil with Rapid Pipelining
    Cut Costs, Not Insights:   A Practical Guide to Telemetry Data Optimization
    Webinar Recap: Telemetry Pipeline 101
    Petabyte Scale, Gigabyte Costs: Mezmo’s Evolution from ElasticSearch to Quickwit
    2024 Recap - Highlights of Mezmo’s product enhancements
    My Favorite Observability and DevOps Articles of 2024
    AWS re:Invent ‘24: Generative AI Observability, Platform Engineering, and 99.9995% Availability
    From Gartner IOCS 2024 Conference: AI, Observability Data, and Telemetry Pipelines
    Our team’s learnings from Kubecon: Use Exemplars, Configuring OTel, and OTTL cookbook
    How Mezmo Uses a Telemetry Pipeline to Handle Metrics, Part II
    Webinar Recap: 2024 DORA Report: Accelerate State of DevOps
    Kubecon ‘24 recap: Patent Trolls, OTel Lessons at Scale, and Principle Platform Abstractions
    Announcing Mezmo Flow: Build a Telemetry Pipeline in 15 minutes
    Key Takeaways from the 2024 DORA Report
    Webinar Recap | Telemetry Data Management: Tales from the Trenches
    What are SLOs/SLIs/SLAs?
    Webinar Recap | Next Gen Log Management: Maximize Log Value with Telemetry Pipelines
    Creating In-Stream Alerts for Telemetry Data
    Creating Re-Usable Components for Telemetry Pipelines
    Optimizing Data for Service Management Objective Monitoring
    More Value From Your Logs: Next Generation Log Management from Mezmo
    A Day in the Life of a Mezmo SRE
    Webinar Recap: Applying a Data Engineering Approach to Telemetry Data
    Dogfooding at Mezmo: How we used telemetry pipeline to reduce data volume
    Unlocking Business Insights with Telemetry Pipelines
    Why Your Telemetry (Observability) Pipelines Need to be Responsive
    How Data Profiling Can Reduce Burnout
    Data Optimization Technique: Route Data to Specialized Processing Chains
    Data Privacy Takeaways from Gartner Security & Risk Summit
    Mastering Telemetry Pipelines: Driving Compliance and Data Optimization
    A Recap of Gartner Security and Risk Summit: GenAI, Augmented Cybersecurity, Burnout
    Why Telemetry Pipelines Should Be A Part Of Your Compliance Strategy
    Pipeline Module: Event to Metric
    Telemetry Data Compliance Module
    OpenTelemetry: The Key To Unified Telemetry Data
    Data optimization technique: convert events to metrics
    What’s New With Mezmo: In-stream Alerting
    How Mezmo Used Telemetry Pipeline to Handle Metrics
    Webinar Recap: Mastering Telemetry Pipelines - A DevOps Lifecycle Approach to Data Management
    Open-source Telemetry Pipelines: An Overview
    SRECon Recap: Product Reliability, Burn Out, and more
    Webinar Recap: How to Manage Telemetry Data with Confidence
    Webinar Recap: Myths and Realities in Telemetry Data Handling
    Using Vector to Build a Telemetry Pipeline Solution
    Managing Telemetry Data Overflow in Kubernetes with Resource Quotas and Limits
    How To Optimize Telemetry Pipelines For Better Observability and Security
    Gartner IOCS Conference Recap: Monitoring and Observing Environments with Telemetry Pipelines
    AWS re:Invent 2023 highlights: Observability at Stripe, Capital One, and McDonald’s
    Webinar Recap: Best Practices for Observability Pipelines
    Introducing Responsive Pipelines from Mezmo
    My First KubeCon - Tales of the K8’s community, DE&I, sustainability, and OTel
    Modernize Telemetry Pipeline Management with Mezmo Pipeline as Code
    How To Profile and Optimize Telemetry Data: A Deep Dive
    Kubernetes Telemetry Data Optimization in Five Steps with Mezmo
    Introducing Mezmo Edge: A Secure Approach To Telemetry Data
    Understand Kubernetes Telemetry Data Immediately With Mezmo’s Welcome Pipeline
    Unearthing Gold: Deriving Metrics from Logs with Mezmo Telemetry Pipeline
    Webinar Recap: The Single Pane of Glass Myth
    Empower Observability Engineers: Enhance Engineering With Mezmo
    Webinar Recap: How to Get More Out of Your Log Data
    Unraveling the Log Data Explosion: New Market Research Shows Trends and Challenges
    Webinar Recap: Unlocking the Full Value of Telemetry Data
    Data-Driven Decision Making: Leveraging Metrics and Logs-to-Metrics Processors
    How To Configure The Mezmo Telemetry Pipeline
    Supercharge Elasticsearch Observability With Telemetry Pipelines
    Enhancing Grafana Observability With Telemetry Pipelines
    Optimizing Your Splunk Experience with Telemetry Pipelines
    Webinar Recap: Unlocking Business Performance with Telemetry Data
    Enhancing Datadog Observability with Telemetry Pipelines
    Transforming Your Data With Telemetry Pipelines