Getting Started with Google Kubernetes Engine (GKE): A Beginner's Guide
There's no shortage of providers willing to host your containers. Many of the world's biggest cloud platforms offer Kubernetes as a service, including features such as automatic scalability and high availability. However, Google Cloud Platform (GCP) stands out as perhaps the best tool for building and hosting a Kubernetes cluster for a number of reasons. In this article, we'll present these reasons and why GCP offers a better Kubernetes experience than other providers.
Why Google Cloud Platform?
Google has a unique advantage when it comes to Kubernetes. Google created Borg, the container orchestration system that laid the groundwork for Kubernetes. Not only does Google know the ins and out of Kubernetes better than anyone else, but GKE tends to receive new features faster than other hosted Kubernetes services.Google Kubernetes Engine (GKE) also offers a streamlined process for spinning up Kubernetes clusters. The Kubernetes master—which runs the Kubernetes control API server, scheduler, and other core components—is fully abstracted away and managed by GKE for free. Containers run on worker nodes, which are Google Compute Engine (GCE) instances that you can either provision yourself or scale automatically based on demand. Since GKE runs unmodified Kubernetes, you can interact with your cluster using standard management tools such as kubectl.GKE also integrates well with other GCP services. If you already host applications, services, or other workloads on GCP, integrating those workloads with your Kubernetes application is significantly easier with GKE.Next, we'll walk through the process of provisioning a new Kubernetes cluster on GKE.
Creating a New GKE Cluster
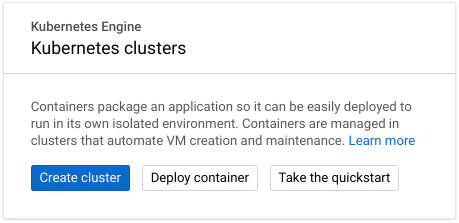
Creating a cluster in GKE is very straightforward. You can use either the browser-based Google Cloud Console, or the Google Cloud SDK. If this is your first time using GKE, you may need to enable the GKE API first. For this article, we'll create a cluster using the Google Cloud Console.With the Google Cloud Console open, select Kubernetes Engine from the left-hand menu and click Create cluster to open the cluster creation menu.
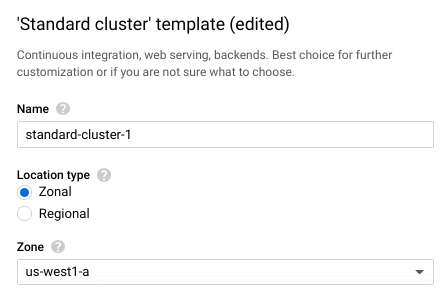
GKE provides multiple preconfigured cluster templates, from minimal test clusters to high availability and GPU accelerated clusters. These templates only provide a starting point; you can still customize the cluster however you choose. For now, select a Standard cluster, which creates 3 moderately sized worker nodes.Enter a name for your cluster in the Name field. The Location type field determines whether your worker nodes are located in a single compute zone (zonal), or distributed across multiple compute zones within a region (regional). Regional clusters can improve availability and resilience by spreading your workers across multiple data centers, keeping your cluster running even if a zone goes offline. However, regional clusters can also incur additional charges. For this example, stick with the default Zonal location type and select a Zone close to your location.
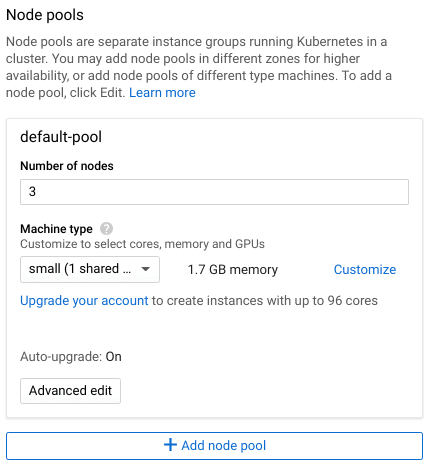
Next, use the Master version field to select the Kubernetes version that your cluster will deploy with. This only determines the initial version of Kubernetes. Google Kubernetes Engine will automatically upgrade your cluster for you, and you can upgrade manually at any time after deployment.Node pools separate your worker nodes into distinct groups. Node pools make it easier to organize worker nodes by zone or Machine type, which is the Google Compute Engine (GCE) template used to provision the node. Each node in a pool is identical in terms of CPU, RAM, storage, and operating system. This makes it easy to organize nodes by zone or machine type. Note that the Machine type plays a significant role in your cluster's overall cost, so consider how much capacity you need to begin with and scale up from there.
The Advanced Edit button lets you modify additional settings, such as cluster autoscaling, automatic upgrades, and assigned service accounts. These settings go beyond the scope of this post, but are important to know when deploying a production cluster.Finally, click Create to provision and deploy your new cluster.
Managing Your GKE Cluster
Once your cluster has finished deploying, you can immediately begin deploying workloads to it. From the cluster list, click the Connect button next to your new cluster. There are three options for managing your GKE cluster:
- Configure the kubectl command line utility on your local workstation using the gcloud command provided
- Use the Cloud Shell to run kubectl
- Use the Workloads dashboard to deploy workloads via the Cloud Console
For this example, we'll use the Cloud Shell to manage the cluster. The Cloud Shell is a virtual console that appears directly in your browser, letting you access your cluster without any additional software or configuration. To open it, click Run in Cloud Shell. The command that appears in the Shell grants the shell access to your cluster. To run it, press Enter.Once the command is complete, check the state of your cluster by running kubectl cluster-info:
user@cloudshell:~ (intro-to-gke)$ kubectl cluster-info
Kubernetes master is running at https://[cluster IP address]
GLBCDefaultBackend is running at https://[cluster IP address]/api/v1/namespaces/kube-system/services/default-http-backend:http/proxy
Heapster is running at https://[cluster IP address]/api/v1/namespaces/kube-system/services/heapster/proxy
KubeDNS is running at https://[cluster IP address]/api/v1/namespaces/kube-system/services/kube-dns:dns/proxy
Metrics-server is running at https://[cluster IP address]/api/v1/namespaces/kube-system/services/https:metrics-server:/proxy
You can verify that each of your nodes is active using kubectl get nodes:
$ kubectl get nodes
gke-[cluster name]-[pool name]-76a685e6-3s9c Ready 9m v1.10.11-gke.1
gke-[cluster name]-[pool name]-76a685e6-jh2v Ready 9m v1.10.11-gke.1
gke-[cluster name]-[pool name]-76a685e6-nvbh Ready 9m v1.10.11-gke.1
With your cluster up and running, you can use any of these three methods to deploy workloads, manage nodes, and enable services such as load balancing and DNS. The GKE Marketplace offers pre-packaged production applications that you can install with a single click. You can also use other GCP services to add additional functionality such as persistent storage via GCE, metrics collection via Stackdriver, and identity and access management (IAM).
Moving Forward with GKE
Google Kubernetes Engine offers a fast and easy solution for deploying a production-grade Kubernetes cluster. In a matter of minutes, you can have your containerized applications and services running in a fully managed Kubernetes environment.At LogDNA, we're big fans of Kubernetes. We make it easy for you to collect, ingest, and monitor Kubernetes logs, no matter the size or distribution of your cluster. Two commands is all you need to monitor your master, your nodes, and your applications.To learn more about LogDNA, contact us, visit our website, or sign up for a 14-day free trial.Also, check out our Kubernetes logging guide.
Table of Contents
Share Article


RSS Feed


.png)


.jpg)


.png)