Continuous integration and continuous deployment (CI/CD) has enabled teams to build and deploy software at a much faster pace. DevOps teams can build, test, and deploy changes to production in a matter of minutes, allowing for extremely rapid release cycles. However, a CI/CD pipeline has a lot of moving parts and steps where problems to occur. In order to ensure a successful deployment, it’s important to monitor each step in this process.
In this article, we’ll show you how you can monitor your entire CI/CD pipeline by logging to Mezmo, formerly known as LogDNA.

Why Should You Monitor Your CI/CD Pipeline?
Implementing a CI/CD pipeline is a complex process involving multiple integrated platforms, tools, and services. Having a consistent and reliable pipeline allows teams to integrate and deploy changes more frequently, in many cases several times a day. If any part of this pipeline fails, your ability to release new features and bug fixes grinds to a halt.
Monitoring helps you stay on top of any problems or risks to your CI/CD pipeline. Since each team implements CI/CD differently, each team’s monitoring strategy will likely vary. However, most if not all CI/CD tools generate log data containing activity logs, diagnostic information, and errors. Using these logs, we can track each step in the CI/CD process and proactively monitor for problems.
Stages in a Typical CI/CD Pipeline
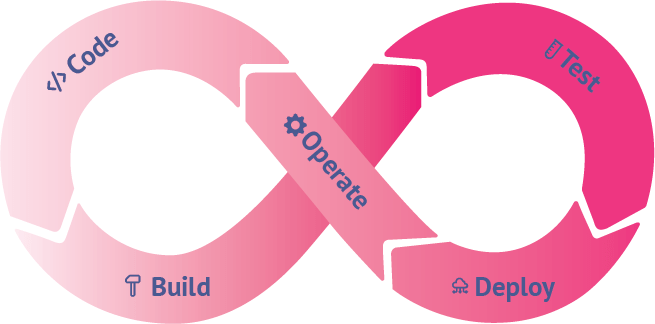
A typical CI/CD pipeline consists of many steps. To demonstrate logging, we’ll break it down into five stages:
- Code
- Build
- Test
- Deploy
- Operate
Code
The CI/CD pipeline starts with source code. Source code management (SCM) tools like Git and SVN provide ways of tracking changes, they often don’t provide ways to track the impact of changes. For example, what if a particular change introduces a bug? What if a branch merge resulted in a successful build, but a failed deployment? What if you want to receive an alert whenever a specific team or team member creates a commit or pull request?
If your team uses GitHub, you can use the Mezmo GitHub integration to track commits, merges, pull requests, administrative actions, deployments and other events affecting your repository. These events appear in the Mezmo web app alongside your other logs, letting you:
- Use live tail, views, and alerts to monitor source code changes in real-time.
- View changes alongside build, test, and application logs to see the impact of specific changes.
- Create detailed analyses such as change velocity and deployment frequency.
To send your GitHub logs to Mezmo, open the Integrations page and follow the prompts to connect your GitHub account. You can select the specific repositories and events that you want Mezmo to monitor. For more detailed instructions, read the documentation page on version control systems, or read our blog post on Monitoring GitHub Activity with Mezmo.
Build
The build process is a critical point of failure for most deployments. If a build fails, the team needs to be notified immediately in order to quickly identify and resolve the problem.
In an automated CI/CD pipeline, builds are triggered by an automation server whenever it detects a change to the source code. Automation servers also maintain logs of builds and internal processes. For example, Jenkins and GitLab generate and store log files on the host machine. Depending on where these logs are stored, you can collect them using the Mezmo agent by adding their paths to the agent configuration file. In the case of GitLab, logs generated when running jobs (such as builds and unit tests) are also sent to syslog. These are automatically picked up by the agent with no additional configuration.
Mezmo also offers integration with hosted CI/CD services. If you use CircleCI, the Mezmo CircleCI Orb automatically forwards build logs to your Mezmo organization. Just add the orb to your repository’s .circleci/config.yml file and add the necessary elements to your workflows and jobs.
Test
It’s not enough to know that your build was successful. It also has to pass a litany of tests to ensure changes don’t introduce bugs or regressions. While there are many different types of tests in the CI/CD process, we’ll focus on unit tests and integration tests.
Logging Unit Tests
Unit tests are small, isolated tests performed on individual application components. They are typically integrated into source code and executed by an automation server during the build process. Frameworks such as JUnit, NUnit, and pytest generate test result reports, but you should also use logging to oversee each step of the testing process. Test reports will tell you what went wrong, but logs will tell you what happened by letting you trace each test’s execution flow.
Since unit tests are executed by an automation server, you can typically log to standard output and the server will automatically collect the logs for you. You can also send your logs directly to Mezmo using one of Mezmo's many code libraries.
Logging Integration Tests
Integration tests are meant to verify that the different components of your application are working together. Broad integration testing might involve testing database connections from various application components, running API tests, or sending requests to third party services. This means deploying your application to a test environment, which requires a much different approach to logs than unit testing.
As with unit tests, you should use in-code logging for insight into your integration tests. Since individual tests will span multiple components, consider adding metadata to your logging statements to help identify specific test cases. For example, if you are using the Mezmo Node.js library, you might use the meta object to store the name of the current test case. This way, you can use the Mezmo web app to search for events that occurred in a specific test run.
If you are executing your tests in a test environment, you should also log the environment itself. This is similar to logging your deployment environment and follows many of the same steps. To differentiate your test environment logs from your production environment logs, consider using tags or separate Mezmo organizations.
Deploy
Depending on where and how you deploy, there are a number of different methods you can use.
If you’re using Kubernetes, you can use the Mezmo DaemonSet to automatically deploy the Mezmo agent to each node in your cluster. The agent collects both application logs and node logs, while adding important metadata such as the container name, Pod name, host, and namespace. The DaemonSet can be deployed over Kubernetes-as-a-service platforms including IBM Cloud Kubernetes Service, Amazon Elastic Kubernetes Service, Google Kubernetes Engine, and Red Hat OpenShift.
Mezmo also integrates with several infrastructure automation tools including Puppet, Chef, Ansible, and SaltStack. These integrations will also collect logs from the tool itself, allowing you to monitor changes to your environment from the Mezmo web app. You can learn more about monitoring SaltStack logs in Mezmo by reading our blog post.
Operate
Monitoring your application post-deployment will not only help keep you aware of any operational problems, but the insights you gather can feed back into future development cycles. You can leverage Mezmo's Views, Live Tail, Alerts and Visualizations to know what's going on with your production applications.
Mezmo's graphing capabilities are especially useful for monitoring production applications. Graphing metrics such as errors, request volume, and response time can help you quickly identify changes in performance or stability over time. If you notice an unusual event, you can drill down to the relevant log messages in order to determine the cause of the problem and begin planning a fix for the next development phase. You can learn more about graphing in our blog post on visualizing log data. Our Timeline feature is unique and quick way to visually see occurrences of a search query over your retention period.
Alerts are also essential for detecting critical issues such as exceptions, downtime, or changes to your infrastructure. Imagine if a newly deployed change caused an unexpected increase in response times. This change may be hard to detect on a graph, but an alert configured to detect unusually high response times will fire instantly. This notifies the development team to prioritize optimizations in the next planning phase before moving on to new features.
Conclusion
Setting up an automated CI/CD pipeline is no small feat, and having a comprehensive monitoring solution in place is important for keeping the process running smoothly. We hope this guide helped you solidify a logging strategy for each step in your CI/CD pipeline.
If you have any questions about the steps or integrations mentioned, contact us to learn more. You can also learn more by checking out our quick start guide and GitHub repositories.
More blog posts