Transforming Your Data With Telemetry Pipelines
Telemetry pipelines are a modern approach to monitoring and analyzing systems that collect, process, and analyze data from different sources (like metrics, traces, and logs). They are designed to provide a comprehensive view of the system’s behavior and identify issues quickly. Data transformation is a key aspect of telemetry pipelines, as it allows for the modification and shaping of data in order to make it more useful for monitoring and analysis. This includes tasks such as filtering and aggregating data, converting data from one format to another, or enriching data with additional information. By using telemetry pipelines, teams can extract actionable insights from their data, improve the context and visibility of their systems, and make better-informed decisions to optimize their performance.
The Traditional Approach to Log Management
Prior to telemetry pipelines, the traditional approach to log management involved collecting log data from various sources (like metrics from servers and custom application logs) and storing them in a centralized logging location. This data was then manually reviewed and analyzed by engineers or security teams in order to identify and troubleshoot issues. This approach was time consuming and prone to errors, as it required manual effort to sift through large volumes of data. It also required the manual correlation of data at search time, which could take a while to do during active investigations. The old way of log management often fell short in providing real-time visibility and actionable insights, and it lacked the automation that Telemetry pipelines now provide. Most importantly, the old way of log management was unsustainable from a cost perspective because its foundation was built on indexing all the data upfront and figuring out what questions to ask later.
Understanding Data Transformation
The days when it was acceptable to send unstructured logs to your log management system and use them to gain insights later are long gone. It’s important to enrich, tag, and correlate your datasets prior to indexing the data, as this provides maximum value at a lower cost. You may be thinking, “why should I transform my data prior to ingestion? It’s working just fine the way it is.” Logging platforms cost a lot of money to use, and as data volume grows year after year, these tools will only get more expensive—and will represent the lion's share of overall IT spending. Additionally, customers will demand better performance with high uptime. Finding better ways to manage your data, increase the value of the insights it generates, and manage costs are crucial when data volume increases everyday.
Data Transformation in Action
Now that we’ve covered the basics of data transformation, let's look at some examples of data aggregation, correlation, enrichment, masking, and filtering.
Data Enrichment
- Tagging can make troubleshooting problems much easier, as it allows you to follow the trail of tags to find the root cause of issues.
- Routing is beneficial since you may need to route specific types of data depending on its sensitivity. Routing data based on these tags helps move data to the correct location.
- Enriching traces adds context like user IDs to specific tags or text from external sources.
Data Masking
- Data masking protects the privacy of sensitive information.
- Data anonymization replaces sensitive data with unique identifiers that protect user identities.
Data Filtering
- Routing different data types to different storage types depending on value and age helps.
- Deduping identical data streams is also important.
- Sampling large data streams helps reduce the volume and velocity of redundant logs.
Data Aggregation
- Tracking the performance of types of function (i.e. counting, summing, or averaging) against a dataset over a specified field (usually time) is beneficial.
- Comparing logs, metrics, and traces against entities helps you get a full picture.
Aggregating logs enables you to convert metrics. To save money on indexing costs, index a single event with your aggregations rather than indexing thousands of events and aggregating after index time.
Data Correlation
- Correlating logs, metrics, and traces by user ID and session ID helps you understand how a particular user’s requests flow through the system.
- Enriching data from IOCs (indicators of compromise) to your log files helps speed up investigations of potential threats.
- Metadata creation like adding new fields along with correlating logs and metrics prior to indexing helps find relationships or anomalies that can explain the root cause of issues.
Schema-on-Write
A schema represents a blueprint or structure for organizing data within a database. It defines the relationships and constraints for how data can be stored and accessed. A schema-on-write strategy is where a schema is defined up-front prior to onboarding (i.e. indexing) data. The benefit of using this method is that it improves query performance significantly and offers predictable results due to standardization. The downside of this method is that it requires you to define the insights you need from your data prior to onboarding the data. This is a huge downside, as it’s difficult to visualize and understand the nuances from design to production.
Schema-on-Read
On the other hand, a schema-on-read type of system will have very limited structure defined prior to onboarding data. This takes the approach of onboarding machine data in many different formats and applying a schema at search time when the query is executed. The downsides of this approach are significantly longer runtimes to gain insights and massive amounts of data to onboard (since you’re trying to get it all). The upside of this approach is that you don’t have to understand all of the insights or nuances prior to onboarding data; rather, you can figure it out and adjust on the fly!
Telemetry Pipelines: A Hybrid Solution
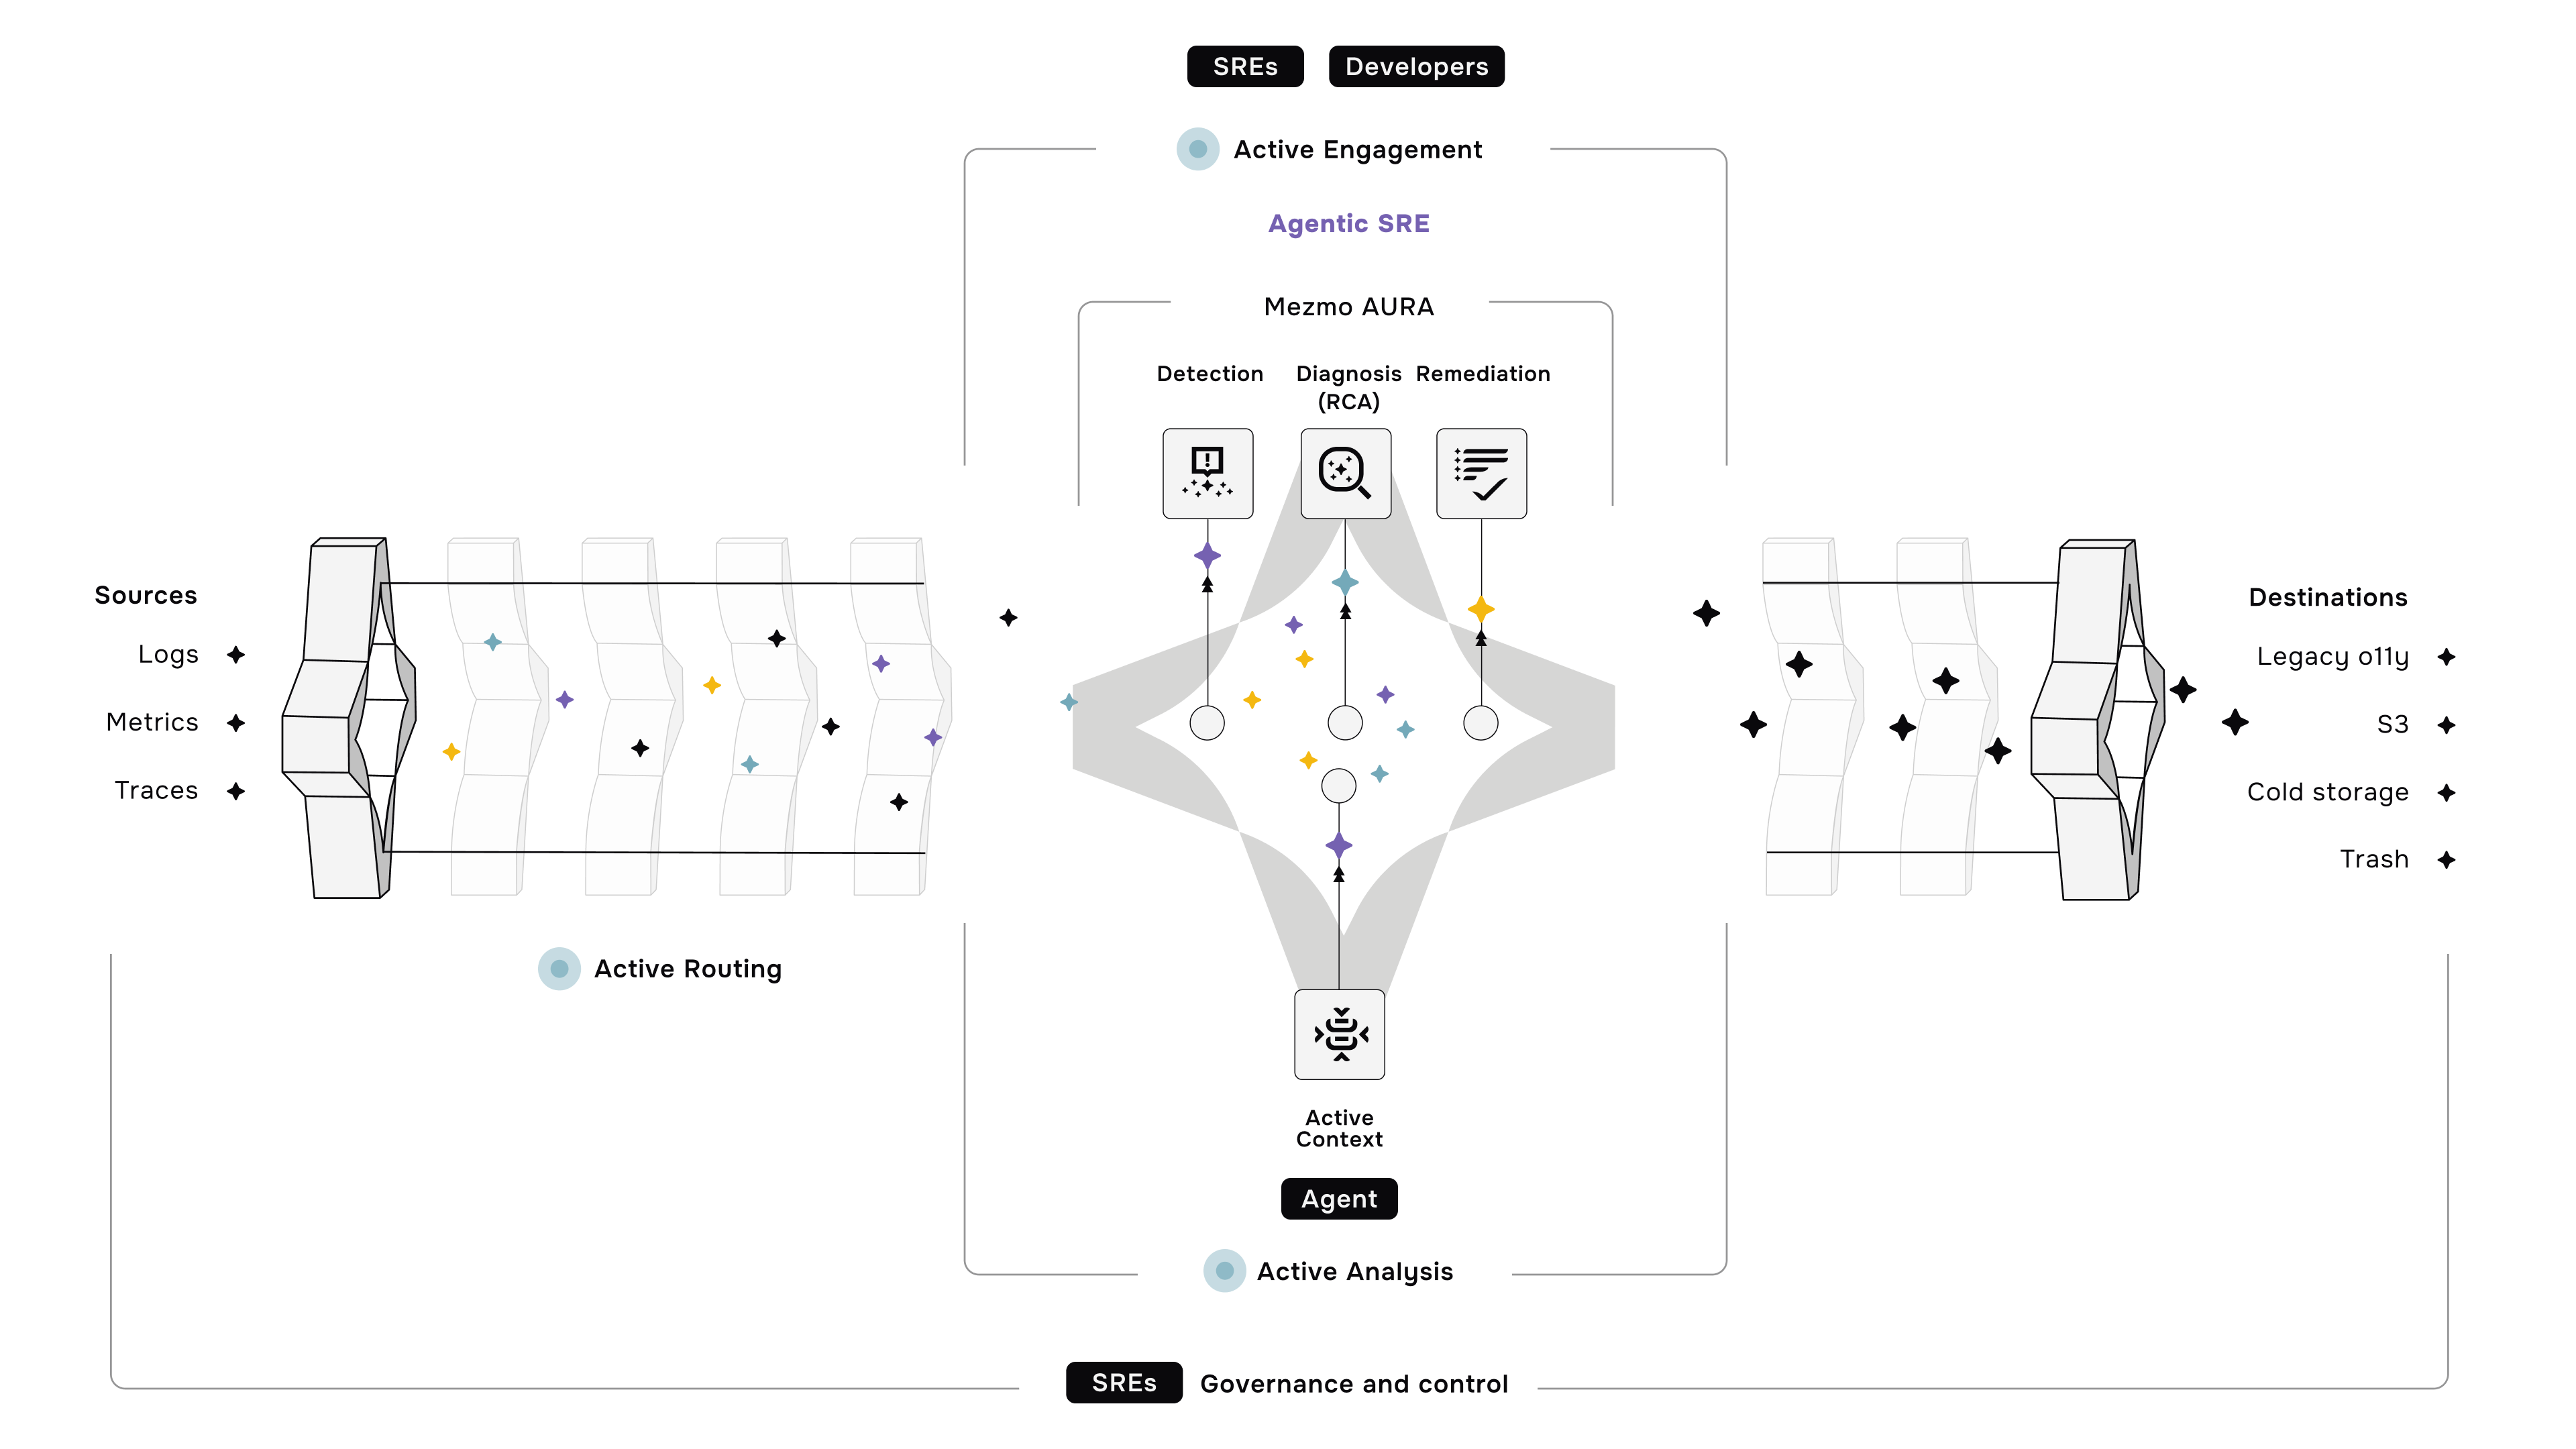
Adding an telemetry pipeline into the mix takes the benefits from both methods (schema-on-read and schema-on-write) and combines them. You can continue to use your existing method to push or pull data from the remote machines, but instead of sending it to your centralized logging platform, you push it through your telemetry pipelines, which will route and transform data prior to indexing. The advantage of this hybrid system is that it allows you to pre-aggregate and transform data and also leverage the speed from the schema-on-write setup without having to immediately define it up front.
What this means for you is that you can continue to onboard unstructured data and have the flexibility to pick which datatypes you want to transform. For example, you may be alerting on a certain number of errors over a particular period of time. Rather than bringing in raw events and creating an alert on your logging platform (which will aggregate and sum these errors over time), you are aggregating prior to indexing and alerting on these single numeric values.
The other benefit here is that rather than indexing all of the unstructured raw data and transforming it in your logging tool, you can drastically cut down on the amount of data being indexed. That’s because you are only indexing a single key-value pair (which represents a single event and may equate to a few bytes) as opposed to thousands of raw events (which could sum up to multiple MBs that equal real dollars).
Now you may be thinking, “yeah that's great, but I need the flexibility to rehydrate old metrics back into raw logs for compliance or security purposes.” This is exactly where an Telemetry pipeline shines! A telemetry pipeline allows you to tag, route, and fork data streams depending on their type and value. With your pipeline, it’s possible to fork a stream of logs, place the raw logs on cheap S3 storage, convert the other stream to metrics, and index the metrics logs (which will then be used to create reports, alerts, and dashboards). You still get the same value from your logs, just in a different way – and at a cheaper cost.
Use Cases for Data Transformation
There are many use cases tied to data transformation, including:
- Data Cleaning: Removing duplicate values, filling in missing values, and standardizing datasets.
- Data Normalization: Converting data into a standard format.
- Data Enrichment: Adding additional information or context to gain better insights.
- Data Aggregation: Combining data from multiple sources to create a summary or a new representation of the data.
- Data Filtering: Removing irrelevant data or subsets of data based on certain criteria.
- Data Conversion: Converting data to a different format, such as XML or JSON.
- Data Masking: Hiding sensitive data like PII or protecting privacy (for example, by hashing out user credentials).
Key Takeaways
Data transformation is a vital step, allowing teams to shape and modify data to make it more useful for monitoring and analysis. By applying techniques such as filtering, aggregation, and enrichment, teams can extract valuable insights from their data and make better-informed decisions to improve the key metrics that the company cares about the most. The use of data transformation techniques within a telemetry pipeline pays dividends, allowing your company to scale and keep budgets in check despite data growth year over year.
If you want to improve the performance and reliability of your systems, consider implementing a telemetry pipeline to enable maximum value via data transformation. By collecting, processing, and analyzing data from different sources, you can extract actionable insights and make better decisions. To get started, consider reading our Data Transformations: Adding Value to Your Telemetry Data white paper. This will further guide you on how to get started with selecting a telemetry pipeline and how to transform your data to maximize value.
.jpg)





.png)




.png)


