The Observability Stack is Collapsing: Why Context-First Data is the Only Path to AI-Powered Root Cause Analysis

4 MIN READ
MIN READ

By Bill Balnave, VP of Customer Success at Mezmo

The core promise of modern observability is simple: cut Mean Time To Resolution (MTTR). Yet, despite a boom in tooling and investment over the last four years, the data tells a sobering story: our industry is actually getting worse at finding and resolving issues.

Dashboards, once our trusted guide, have become the starting point for a chaotic "dashboard hunt" that rarely leads to the definitive root cause. The problem isn't a lack of data; it's a fundamental architectural flaw in how we handle it.

The old paradigm—dumping all telemetry data into a massive repository because we're afraid we'll miss something—is finally collapsing under its own weight.

1. The Trap of Passive Telemetry

The current observability approach is built on fear and volume:

  1. The Stack Grows Taller: Complex applications generate logs, metrics, and traces at an incredible rate.
  2. The Data Pile Grows Higher: Engineers feed all of this data into a huge, single repository.
  3. The Dashboards Multiply: We build reports and analytics on top of the pile, constantly updating or creating new dashboards to chase new problems.

This storage-first approach forces engineers to perform manual correlation across multiple teams and tools, wading through a sea of log files to piece together a sequence of events—a process that is rarely neat or orderly.

The data collected in this manner is inherently INACTIVE. It lacks identity, intent, and crucial context. Its value is entirely temporal, existing only in case something happens to require it. Most of the time, this "high-entropy telemetry" is simply a pile of fragments waiting for a human or a tool to reconstruct meaning after storage.

2. Why AI Fails with the Old Paradigm

As AI adoption accelerates, we risk forcing this same broken paradigm onto our models. Many organizations are attempting to achieve Root Cause Analysis (RCA) by throwing tons of this raw, inactive data into specialized models.

But AI agents aren't human; they operate from fact, not fear. When fed this unstructured application exhaust, AI struggles.

The result isn't insight—it’s statistical storytelling. Inactive telemetry becomes "beautifully formatted ignorance; structured noise with no connective tissue". AI cannot reason about relationships that were never captured, leading to confident but incorrect predictions that do nothing to improve MTTR.

The failure isn't the model's intelligence—it’s the data architecture.

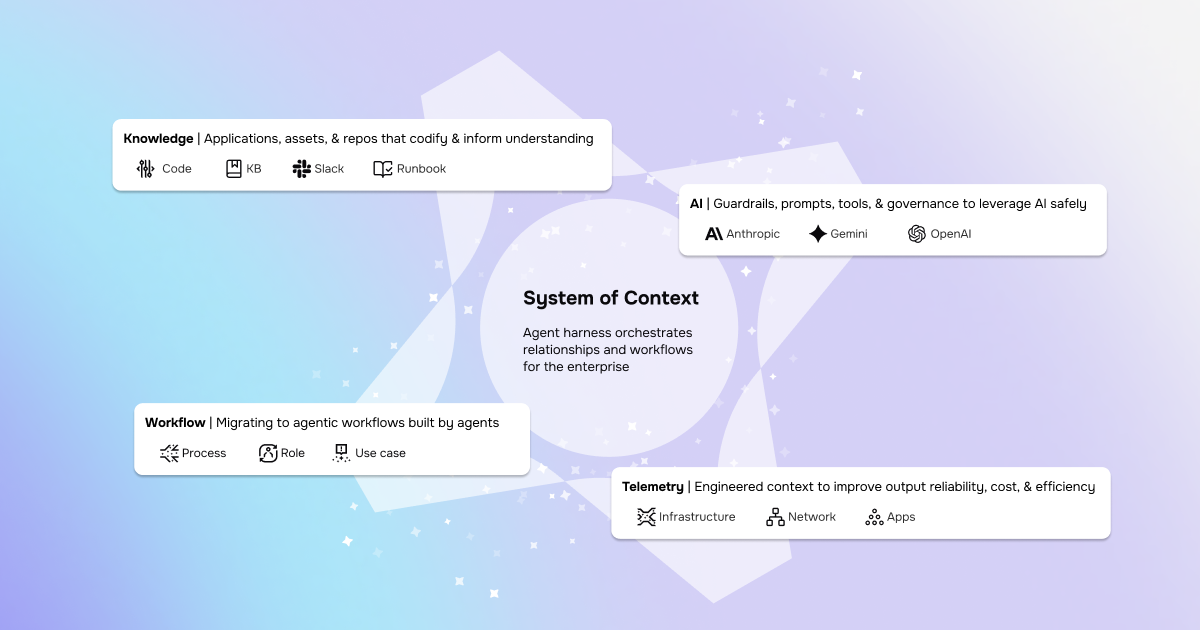
3. The Architectural Correction: Context-First Telemetry

The solution is not about building more specialized models; in fact, publicly available models can be highly effective. The correction is architectural: trading Inactive Telemetry for Active Telemetry.

Instead of building context after storage, context must be built into the telemetry itself while it's in motion. This process involves:

  • Understanding the value of the data.
  • Normalizing and enriching the signals.
  • Deduplicating, semantically grouping, and simplifying the data before it ever reaches the model.

By focusing on what’s important, we drastically reduce the possibilities the model has to process, allowing it to focus on the core problem. This Context Engineering approach leads to more accurate results, requires fewer tokens, and drastically cuts cost.

4. Context Engineering: A Data-Driven Advantage

We know this works because we put it to the test against a common industry benchmark. Last year, a ClickHouse blog post asked: “Can LLMs replace on-call SREs today?” Their conclusion was that LLMs were not ready, citing a bottleneck of "missing context".

Factor Traditional Prompt Engineering (Raw Data) Context Engineering (Mezmo)
RCA Accuracy Inconsistent, even with top models ✅ Accurate RCA on first try
Guidance Required Yes, often multiple prompts ❌ None needed
Token Efficiency 45K – 1.2M tokens ✅ ~27K total
Cost $1–$6 typical per incident ✅ $0.06 per incident
Tool / API Calls 12–27 per incident ✅ 1 call
Context Quality Raw logs, traces, metrics ✅ Curated, scoped context

By implementing a context-first approach using a telemetry pipeline, we ran the same benchmark errors and achieved accurate RCA on the first pass every time. The results were definitive: LLMs are ready to be a significant help for Root Cause Analysis—but only if we arm them with the right data architecture.

This approach is already being validated by early customer feedback, where it has led to a significant reduction in time to identify and resolve issues, and even pinpointed the source of nagging problems that humans had tried to find for months.

Want to dive deeper? Schedule some time with the Mezmo team.

Table of Contents

    Share Article

    RSS Feed

    Next blog post
    You're viewing our latest blog post.
    Previous blog post
    You're viewing our oldest blog post.
    The Observability Stack is Collapsing: Why Context-First Data is the Only Path to AI-Powered Root Cause Analysis
    Mezmo + Catchpoint deliver observability SREs can rely on
    Mezmo’s AI-powered Site Reliability Engineering (SRE) agent for Root Cause Analysis (RCA)
    What is Active Telemetry
    Launching an agentic SRE for root cause analysis
    Paving the way for a new era: Mezmo's Active Telemetry
    The Answer to SRE Agent Failures: Context Engineering
    Empowering an MCP server with a telemetry pipeline
    The Debugging Bottleneck: A Manual Log-Sifting Expedition
    The Smartest Member of Your Developer Ecosystem: Introducing the Mezmo MCP Server
    Your New AI Assistant for a Smarter Workflow
    The Observability Problem Isn't Data Volume Anymore—It's Context
    Beyond the Pipeline: Data Isn't Oil, It's Power.
    The Platform Engineer's Playbook: Mastering OpenTelemetry & Compliance with Mezmo and Dynatrace
    From Alert to Answer in Seconds: Accelerating Incident Response in Dynatrace
    Taming Your Dynatrace Bill: How to Cut Observability Costs, Not Visibility
    Architecting for Value: A Playbook for Sustainable Observability
    How to Cut Observability Costs with Synthetic Monitoring and Responsive Pipelines
    Unlock Deeper Insights: Introducing GitLab Event Integration with Mezmo
    Introducing the New Mezmo Product Homepage
    The Inconvenient Truth About AI Ethics in Observability
    Observability's Moneyball Moment: How AI Is Changing the Game (Not Ending It)
    Do you Grok It?
    Top Five Reasons Telemetry Pipelines Should Be on Every Engineer’s Radar
    Is It a Cup or a Pot? Helping You Pinpoint the Problem—and Sleep Through the Night
    Smarter Telemetry Pipelines: The Key to Cutting Datadog Costs and Observability Chaos
    Why Datadog Falls Short for Log Management and What to Do Instead
    Telemetry for Modern Apps: Reducing MTTR with Smarter Signals
    Transforming Observability: Simpler, Smarter, and More Affordable Data Control
    Datadog: The Good, The Bad, The Costly
    Mezmo Recognized with 25 G2 Awards for Spring 2025
    Reducing Telemetry Toil with Rapid Pipelining
    Cut Costs, Not Insights:   A Practical Guide to Telemetry Data Optimization
    Webinar Recap: Telemetry Pipeline 101
    Petabyte Scale, Gigabyte Costs: Mezmo’s Evolution from ElasticSearch to Quickwit
    2024 Recap - Highlights of Mezmo’s product enhancements
    My Favorite Observability and DevOps Articles of 2024
    AWS re:Invent ‘24: Generative AI Observability, Platform Engineering, and 99.9995% Availability
    From Gartner IOCS 2024 Conference: AI, Observability Data, and Telemetry Pipelines
    Our team’s learnings from Kubecon: Use Exemplars, Configuring OTel, and OTTL cookbook
    How Mezmo Uses a Telemetry Pipeline to Handle Metrics, Part II
    Webinar Recap: 2024 DORA Report: Accelerate State of DevOps
    Kubecon ‘24 recap: Patent Trolls, OTel Lessons at Scale, and Principle Platform Abstractions
    Announcing Mezmo Flow: Build a Telemetry Pipeline in 15 minutes
    Key Takeaways from the 2024 DORA Report
    Webinar Recap | Telemetry Data Management: Tales from the Trenches
    What are SLOs/SLIs/SLAs?
    Webinar Recap | Next Gen Log Management: Maximize Log Value with Telemetry Pipelines
    Creating In-Stream Alerts for Telemetry Data
    Creating Re-Usable Components for Telemetry Pipelines
    Optimizing Data for Service Management Objective Monitoring
    More Value From Your Logs: Next Generation Log Management from Mezmo
    A Day in the Life of a Mezmo SRE
    Webinar Recap: Applying a Data Engineering Approach to Telemetry Data
    Dogfooding at Mezmo: How we used telemetry pipeline to reduce data volume
    Unlocking Business Insights with Telemetry Pipelines
    Why Your Telemetry (Observability) Pipelines Need to be Responsive
    How Data Profiling Can Reduce Burnout
    Data Optimization Technique: Route Data to Specialized Processing Chains
    Data Privacy Takeaways from Gartner Security & Risk Summit
    Mastering Telemetry Pipelines: Driving Compliance and Data Optimization
    A Recap of Gartner Security and Risk Summit: GenAI, Augmented Cybersecurity, Burnout
    Why Telemetry Pipelines Should Be A Part Of Your Compliance Strategy
    Pipeline Module: Event to Metric
    Telemetry Data Compliance Module
    OpenTelemetry: The Key To Unified Telemetry Data
    Data optimization technique: convert events to metrics
    What’s New With Mezmo: In-stream Alerting
    How Mezmo Used Telemetry Pipeline to Handle Metrics
    Webinar Recap: Mastering Telemetry Pipelines - A DevOps Lifecycle Approach to Data Management
    Open-source Telemetry Pipelines: An Overview
    SRECon Recap: Product Reliability, Burn Out, and more
    Webinar Recap: How to Manage Telemetry Data with Confidence
    Webinar Recap: Myths and Realities in Telemetry Data Handling
    Using Vector to Build a Telemetry Pipeline Solution
    Managing Telemetry Data Overflow in Kubernetes with Resource Quotas and Limits
    How To Optimize Telemetry Pipelines For Better Observability and Security
    Gartner IOCS Conference Recap: Monitoring and Observing Environments with Telemetry Pipelines
    AWS re:Invent 2023 highlights: Observability at Stripe, Capital One, and McDonald’s
    Webinar Recap: Best Practices for Observability Pipelines
    Introducing Responsive Pipelines from Mezmo
    My First KubeCon - Tales of the K8’s community, DE&I, sustainability, and OTel
    Modernize Telemetry Pipeline Management with Mezmo Pipeline as Code
    How To Profile and Optimize Telemetry Data: A Deep Dive
    Kubernetes Telemetry Data Optimization in Five Steps with Mezmo
    Introducing Mezmo Edge: A Secure Approach To Telemetry Data
    Understand Kubernetes Telemetry Data Immediately With Mezmo’s Welcome Pipeline
    Unearthing Gold: Deriving Metrics from Logs with Mezmo Telemetry Pipeline
    Webinar Recap: The Single Pane of Glass Myth
    Empower Observability Engineers: Enhance Engineering With Mezmo
    Webinar Recap: How to Get More Out of Your Log Data
    Unraveling the Log Data Explosion: New Market Research Shows Trends and Challenges
    Webinar Recap: Unlocking the Full Value of Telemetry Data
    Data-Driven Decision Making: Leveraging Metrics and Logs-to-Metrics Processors
    How To Configure The Mezmo Telemetry Pipeline
    Supercharge Elasticsearch Observability With Telemetry Pipelines
    Enhancing Grafana Observability With Telemetry Pipelines
    Optimizing Your Splunk Experience with Telemetry Pipelines
    Webinar Recap: Unlocking Business Performance with Telemetry Data
    Enhancing Datadog Observability with Telemetry Pipelines