How to Leverage Mezmo Archiving

4 MIN READ
MIN READ

LogDNA is now Mezmo but the product you know and love is here to stay.

Log archiving is the process of storing all kinds of logs (application, system, or monitoring) from across a multitude of systems in a long-term storage solution like S3. Securely collecting and keeping logs is crucial for many businesses, and they have to do it effectively and with minimal supervision.

This tutorial will show you how to leverage Mezmo's archiving feature. We’ll walk you through the process of setting up automatic archiving following the official documentation. We’ll also explain why you should archive logs and what other benefits you can gain from doing so. Then, we’ll explore Mezmo's new variable retention feature, which allows users to retain certain logs for various periods and then send them to archiving, thereby maximizing cost efficiency. Finally, we will introduce you to an upcoming feature called rehydration, which will allow you to send previously archived logs back to the platform for further analysis.

Let’s get started.

Why Archive Logs?

You may be asking yourself, “why is archiving logs so important, anyway?” Well, it depends on what kind of business you have and what type of data you are processing.

For some organizations, log retention and archiving is of secondary importance, and is typically done to provide historical context. Others might need logs for security purposes, such as tracking network logs for signs of compromise when an incident occurs. 

However, many organizations have to archive logs per regulatory compliance rules and regulations. As an example, HIPAA compliance mandates that logs should be kept for a minimum of six years in a specific format. PCI DSS on the other hand requires a shorter period (1 year minimum). In either case, companies have to adhere to appropriate log retention policies for auditors, demonstrate efficient security and storage requirements, or face hefty fines.

A log archiving tool can help your organization adhere to these requirements by letting you save your log messages to files, disks, or any other storage medium. In an ideal world, you would store only the minimum log data required with minimal supervision, but with the flexibility to go back and search through the logs easily.

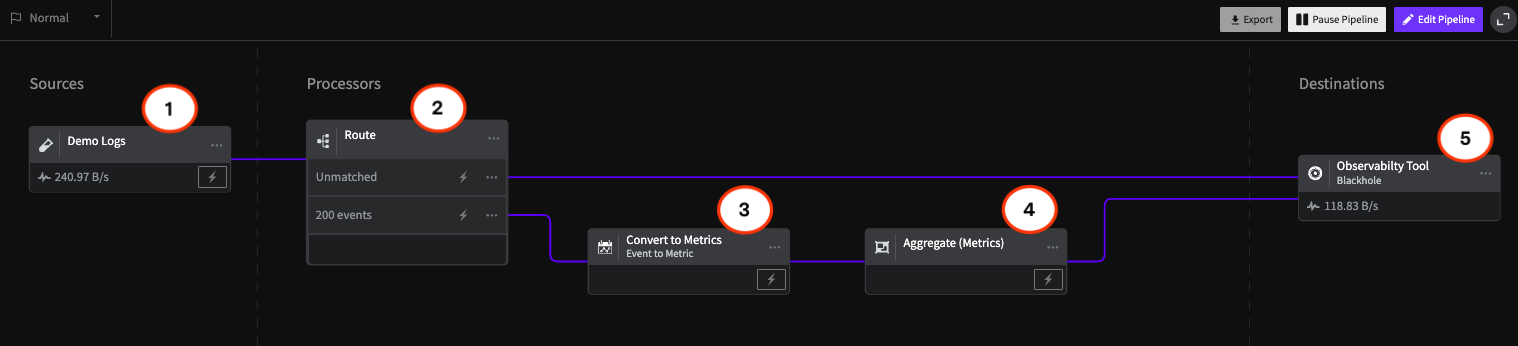
How to Archive Logs with Mezmo

Archiving logs is straightforward with Mezmo. All you need is a supported S3 block storage provider with the proper permissions, and Mezmo will handle the rest.

First, you need to enable archiving for your account, as shown in this screenshot:


Figure 1: Enabling Archiving


Once you've enabled archiving, you'll have the option to select a block storage provider. Mezmo supports all major cloud providers, including Amazon, GCloud, and Azure. For simplicity, we will use DigitalOcean block storage for this tutorial.

Next, you'll have to configure settings based on your chosen provider. For DigitalOcean, you'll need the name, endpoint, and access/secret key pairs of the DigitalOcean Spaces. Just the bucket ARN will do for S3 (assuming that you have the correct bucket permissions). For Azure, you will have to fill in the account name and key fields.

Enter the configuration settings for your selected provider. Make sure that the endpoint name is in the correct format. For example:


fra1.digitaloceanspaces.com


Otherwise, the settings won’t save.


Figure 2: Configuring Archiving


That's it! Now, Mezmo will segment and send your logs hourly in a compressed format. However, it might take a day to see the logs in the block storage for the first time.

You can access the stored files by navigating to the block storage provider and inspecting the gzipped files:


Figure 3: Gzipped Files


If you want to prevent certain log lines from being logged and subsequently archived (for example, lines from a particular host or app), you may want to configure exclusion rules using the appropriate option in the Manage Usage tab:


Figure 4: Configuring Exclusion Rules


Now that you've configured archiving, you can check out what the new variable retention feature has to offer.

Variable Retention

Once you've set up your archive, you might want to have more control over when your logs are archived in the block storage, or kept in live dashboards, because you cannot have all data live simultaneously without inevitable logistical tradeoffs. Logging can be expensive, and keeping massive amounts of data in memory causes all sorts of problems with locality, cost-efficiency, and insights.

Variable retention comes into play here, enabling teams to control which logs they want to keep in the live dashboard, and which logs they want to archive sooner. Enterprise Mezmo customers can sign up for the private beta program, which gives them access to four tiers of retention times:3, 7, 14, or 30 days.

As a reminder, Mezmo customers have a fixed retention time depending on their current plan. With variable retention, you  gain the option to configure further the log retention time based on rules like hosts, apps, levels, or custom queries, as shown in this screenshot:


Figure 5: Variable Retention Page


Mezmo is also getting ready to introduce another new feature called rehydration. We'll explain what that is and how it helps in the next section.

Rehydration

Once you've had data archived in your block storage for a while, you might want to analyze it using the Mezmo dashboard, which offers superb visualization capabilities. Or maybe you've experienced an incident that involves tracing network logs spanning multiple periods, and want to create reports.

Rehydration will let you send your archived logs back into LogDNA for delayed root cause analysis or auditing. That would be enormously useful if your organization was being audited and needed to produce logs on the fly. The IT team would then be capable of configuring rehydration rules to showcase and print historical logged events within the Mezmo dashboard.

You can sign up for Mezmo's beta program for log data restoration here.

Next Steps with Observability and Logging

You should bookmark Mezmo's blog resources to keep up-to-date with relevant industry news concerning observability and logging best practices. Adopting Mezmo as your leading logging service is a great way to help your DevOps teams by providing a trusted tool to handle all of their logging needs.

Table of Contents

    Share Article

    RSS Feed

    Next blog post
    You're viewing our latest blog post.
    Previous blog post
    You're viewing our oldest blog post.
    Mezmo + Catchpoint deliver observability SREs can rely on
    Mezmo’s AI-powered Site Reliability Engineering (SRE) agent for Root Cause Analysis (RCA)
    What is Active Telemetry
    Launching an agentic SRE for root cause analysis
    Paving the way for a new era: Mezmo's Active Telemetry
    The Answer to SRE Agent Failures: Context Engineering
    Empowering an MCP server with a telemetry pipeline
    The Debugging Bottleneck: A Manual Log-Sifting Expedition
    The Smartest Member of Your Developer Ecosystem: Introducing the Mezmo MCP Server
    Your New AI Assistant for a Smarter Workflow
    The Observability Problem Isn't Data Volume Anymore—It's Context
    Beyond the Pipeline: Data Isn't Oil, It's Power.
    The Platform Engineer's Playbook: Mastering OpenTelemetry & Compliance with Mezmo and Dynatrace
    From Alert to Answer in Seconds: Accelerating Incident Response in Dynatrace
    Taming Your Dynatrace Bill: How to Cut Observability Costs, Not Visibility
    Architecting for Value: A Playbook for Sustainable Observability
    How to Cut Observability Costs with Synthetic Monitoring and Responsive Pipelines
    Unlock Deeper Insights: Introducing GitLab Event Integration with Mezmo
    Introducing the New Mezmo Product Homepage
    The Inconvenient Truth About AI Ethics in Observability
    Observability's Moneyball Moment: How AI Is Changing the Game (Not Ending It)
    Do you Grok It?
    Top Five Reasons Telemetry Pipelines Should Be on Every Engineer’s Radar
    Is It a Cup or a Pot? Helping You Pinpoint the Problem—and Sleep Through the Night
    Smarter Telemetry Pipelines: The Key to Cutting Datadog Costs and Observability Chaos
    Why Datadog Falls Short for Log Management and What to Do Instead
    Telemetry for Modern Apps: Reducing MTTR with Smarter Signals
    Transforming Observability: Simpler, Smarter, and More Affordable Data Control
    Datadog: The Good, The Bad, The Costly
    Mezmo Recognized with 25 G2 Awards for Spring 2025
    Reducing Telemetry Toil with Rapid Pipelining
    Cut Costs, Not Insights:   A Practical Guide to Telemetry Data Optimization
    Webinar Recap: Telemetry Pipeline 101
    Petabyte Scale, Gigabyte Costs: Mezmo’s Evolution from ElasticSearch to Quickwit
    2024 Recap - Highlights of Mezmo’s product enhancements
    My Favorite Observability and DevOps Articles of 2024
    AWS re:Invent ‘24: Generative AI Observability, Platform Engineering, and 99.9995% Availability
    From Gartner IOCS 2024 Conference: AI, Observability Data, and Telemetry Pipelines
    Our team’s learnings from Kubecon: Use Exemplars, Configuring OTel, and OTTL cookbook
    How Mezmo Uses a Telemetry Pipeline to Handle Metrics, Part II
    Webinar Recap: 2024 DORA Report: Accelerate State of DevOps
    Kubecon ‘24 recap: Patent Trolls, OTel Lessons at Scale, and Principle Platform Abstractions
    Announcing Mezmo Flow: Build a Telemetry Pipeline in 15 minutes
    Key Takeaways from the 2024 DORA Report
    Webinar Recap | Telemetry Data Management: Tales from the Trenches
    What are SLOs/SLIs/SLAs?
    Webinar Recap | Next Gen Log Management: Maximize Log Value with Telemetry Pipelines
    Creating In-Stream Alerts for Telemetry Data
    Creating Re-Usable Components for Telemetry Pipelines
    Optimizing Data for Service Management Objective Monitoring
    More Value From Your Logs: Next Generation Log Management from Mezmo
    A Day in the Life of a Mezmo SRE
    Webinar Recap: Applying a Data Engineering Approach to Telemetry Data
    Dogfooding at Mezmo: How we used telemetry pipeline to reduce data volume
    Unlocking Business Insights with Telemetry Pipelines
    Why Your Telemetry (Observability) Pipelines Need to be Responsive
    How Data Profiling Can Reduce Burnout
    Data Optimization Technique: Route Data to Specialized Processing Chains
    Data Privacy Takeaways from Gartner Security & Risk Summit
    Mastering Telemetry Pipelines: Driving Compliance and Data Optimization
    A Recap of Gartner Security and Risk Summit: GenAI, Augmented Cybersecurity, Burnout
    Why Telemetry Pipelines Should Be A Part Of Your Compliance Strategy
    Pipeline Module: Event to Metric
    Telemetry Data Compliance Module
    OpenTelemetry: The Key To Unified Telemetry Data
    Data optimization technique: convert events to metrics
    What’s New With Mezmo: In-stream Alerting
    How Mezmo Used Telemetry Pipeline to Handle Metrics
    Webinar Recap: Mastering Telemetry Pipelines - A DevOps Lifecycle Approach to Data Management
    Open-source Telemetry Pipelines: An Overview
    SRECon Recap: Product Reliability, Burn Out, and more
    Webinar Recap: How to Manage Telemetry Data with Confidence
    Webinar Recap: Myths and Realities in Telemetry Data Handling
    Using Vector to Build a Telemetry Pipeline Solution
    Managing Telemetry Data Overflow in Kubernetes with Resource Quotas and Limits
    How To Optimize Telemetry Pipelines For Better Observability and Security
    Gartner IOCS Conference Recap: Monitoring and Observing Environments with Telemetry Pipelines
    AWS re:Invent 2023 highlights: Observability at Stripe, Capital One, and McDonald’s
    Webinar Recap: Best Practices for Observability Pipelines
    Introducing Responsive Pipelines from Mezmo
    My First KubeCon - Tales of the K8’s community, DE&I, sustainability, and OTel
    Modernize Telemetry Pipeline Management with Mezmo Pipeline as Code
    How To Profile and Optimize Telemetry Data: A Deep Dive
    Kubernetes Telemetry Data Optimization in Five Steps with Mezmo
    Introducing Mezmo Edge: A Secure Approach To Telemetry Data
    Understand Kubernetes Telemetry Data Immediately With Mezmo’s Welcome Pipeline
    Unearthing Gold: Deriving Metrics from Logs with Mezmo Telemetry Pipeline
    Webinar Recap: The Single Pane of Glass Myth
    Empower Observability Engineers: Enhance Engineering With Mezmo
    Webinar Recap: How to Get More Out of Your Log Data
    Unraveling the Log Data Explosion: New Market Research Shows Trends and Challenges
    Webinar Recap: Unlocking the Full Value of Telemetry Data
    Data-Driven Decision Making: Leveraging Metrics and Logs-to-Metrics Processors
    How To Configure The Mezmo Telemetry Pipeline
    Supercharge Elasticsearch Observability With Telemetry Pipelines
    Enhancing Grafana Observability With Telemetry Pipelines
    Optimizing Your Splunk Experience with Telemetry Pipelines
    Webinar Recap: Unlocking Business Performance with Telemetry Data
    Enhancing Datadog Observability with Telemetry Pipelines
    Transforming Your Data With Telemetry Pipelines