Mezmo vs. Amazon CloudWatch

4 MIN READ
MIN READ

LogDNA is now Mezmo but the insights you know and love are here to stay.

What Is Amazon CloudWatch

Amazon CloudWatch is a log monitoring and management service from Amazon Web Services (AWS). It’s designed to provide DevOps engineers, site reliability engineers (SREs), IT administrators, and software engineers access to metrics, data, and statistics to help understand their operations. It allows users to gather metrics and logs from three sources: vendor logs that are supported and published by AWS on behalf of the customer, logs published by AWS Services, and custom logs. CloudWatch also allows users to collect and aggregate pre-ordained and custom metrics. The built-in default metrics pull from AWS services, including AWS Lambda, API Gateway, EC2, S3, ECS, and DynamoDB. 

Disadvantages and Limitations of Amazon CloudWatch 

CloudWatch is optimized for AWS logs. Although it supports log ingestion from sources outside of AWS, you can only ingest them using their agent. It doesn’t support ingestion via Syslog, APIs, or code libraries. Depending on your needs, there is a lot of customization work required to set it up, which may require an expert on your team to get started. Once you’ve managed to get your logs into the service, searching them in the CloudWatch user interface (UI) and command line interface (CLI) is tedious and complex. Other expected features like data visualizations and alerts are extremely limited in CloudWatch. It is missing integrations with commonly used tools like Slack and PagerDuty and doesn't support Webhooks, making it difficult for engineers to receive notifications of issues when they arise. 

Lastly, CloudWatch offers complicated pricing and is notorious for surprise overages.  With the paid tier, users pay for utilization every month. The first 10,000 metrics are billed at $.30/mo, after which the next 240,000 metrics are $.10/mo, the next 750,000 at $.05/mo, and anything upwards of 1,000,000 metrics is billed at $.02/mo. Up to 5 statistics for the same metric in single GetMetricData API requests are included. Afterwards, the bill starts at $.01 per 1,000 metric requests, except GetMetricWidgetImage metrics, which are $.02 per 1,000 requests. Metric streams are available at $.003 per 1,000 metric updates. 

Dashboards cost $3 per dashboard per month. Alarms range in price from $.10 to $.90 per alarm, depending on the resolution and nature of the alarm. 

There is no cost for log data transfer, but data transfer out is priced depending on where and how much data goes. Collection is billed at $.50/GB, Storage at $.03/GB, and Analysis at $.005/GB. Vendor logs are billed at tiers up to 10TB..

Events bill users at a rate of $1 per million events and $1 per million cross-account events.

CloudWatch Contributor Insights for Cloud Watch bill at $.50/rule per month and $.02 per one million log events that match the rule. CloudWatch Contributor Insights for DynamoDB also bills at $.50/rule per month, but events bill at $.03 per one million logs that match the event per month.

Canaries run at $.0012 per canary run, although they may incur additional charges for other AWS services that are also utilizing them.

If you made it through all of that, congrats. If you’re confused, take a deep breath and read the next section—your logging bill doesn’t have to give you anxiety. 

Benefits of Using Mezmo 

Mezmo, formerly known as LogDNA, has a lot of people on the internet with nice things to say about it. We chose this review from G2 Crowd because it sums up the benefit of using Mezmo over CloudWatch pretty darn well. 

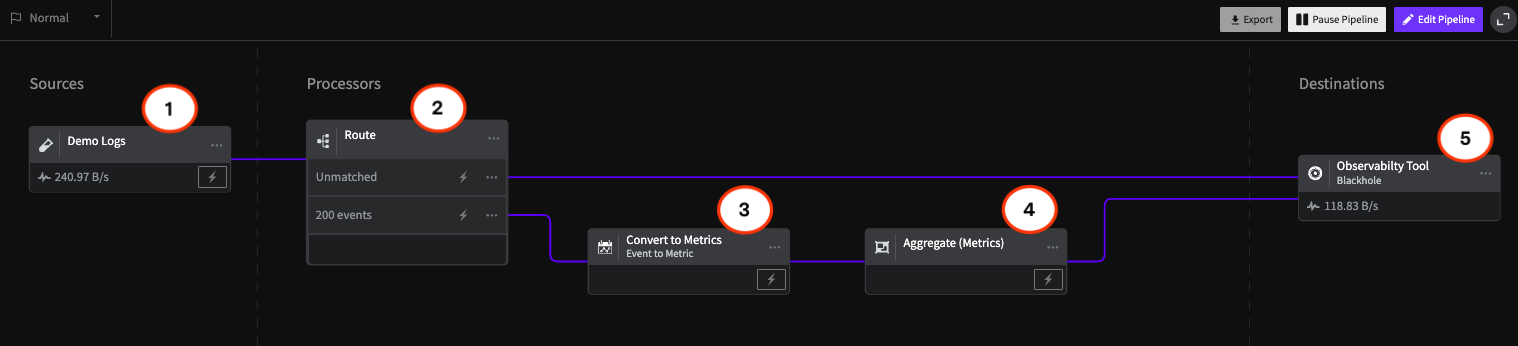
Use the Mezmo Agent, Syslog, APIs, or code libraries to aggregate your logs from any source and we’ll intelligently detect the log type, automatically parse them, and index them in a way that makes keyword search fast and easy to use. You can save Views for a shortcut to a specific set of filters and search queries, visualize your logs using Boards, Graphs, and Screens, and receive real-time Alerts in PagerDuty, Slack, email, or anywhere else via a custom Webhook. 

Mezmo Pricing

Mezmo charges based on the volume of logs stored for a set period of time. Simple, right? All of our self service plans are compliant with SOC 2 Type 2, PCI-DSS, GDPR, EU-US Privacy Shield, and CCPA, and we offer a HIPAA-compliant logging plan—no contract needed! We offer multiple control features to self service customers including Exclusion Rules, which allow you to filter out logs by sources, by apps, or by specific queries that you want to see in Live Tail and be alerted on, but that you don’t want to store. Since we charge based on retention, these logs won’t count towards your bill. You can also automatically archive logs to Amazon S3, IBM Cloud Object Storage, Google Cloud Storage, Azure Blob Storage, and more. 

For enterprise customers who need advanced control features, Mezmo launched the Spike Protection Bundle, which includes Index Rate Alerting and Usage Quotas. When there’s an unexpected spike in ingestion, Index Rate Alerting provides actionable insight into which applications, sources, or tags produced the data spike, as well as any recently added sources. Usage Quotas let you specify soft and hard thresholds for the volume of log files to store. When the threshold is met, Mezmo will notify you and apply your defined configurations. 

Earlier this month, we announced our early access program for Variable Retention, which gives you the flexibility to save logs in Mezmo only for the amount of time that they're relevant. This makes it possible to ingest new types of log data while keeping cost under control, allowing teams to leverage their logs for even more use cases. Our engineering team has even more control features on the product roadmap that will become available over the course of the next year. 

Simply put, if you want to centralize your logs from any source, be alerted when something’s not right, search them with natural language, and visualize them to identify trends and anomalies, choose Mezmo. Get started with your fully-featured 14-day free trial now

Table of Contents

    Share Article

    RSS Feed

    Next blog post
    You're viewing our latest blog post.
    Previous blog post
    You're viewing our oldest blog post.
    Mezmo + Catchpoint deliver observability SREs can rely on
    Mezmo’s AI-powered Site Reliability Engineering (SRE) agent for Root Cause Analysis (RCA)
    What is Active Telemetry
    Launching an agentic SRE for root cause analysis
    Paving the way for a new era: Mezmo's Active Telemetry
    The Answer to SRE Agent Failures: Context Engineering
    Empowering an MCP server with a telemetry pipeline
    The Debugging Bottleneck: A Manual Log-Sifting Expedition
    The Smartest Member of Your Developer Ecosystem: Introducing the Mezmo MCP Server
    Your New AI Assistant for a Smarter Workflow
    The Observability Problem Isn't Data Volume Anymore—It's Context
    Beyond the Pipeline: Data Isn't Oil, It's Power.
    The Platform Engineer's Playbook: Mastering OpenTelemetry & Compliance with Mezmo and Dynatrace
    From Alert to Answer in Seconds: Accelerating Incident Response in Dynatrace
    Taming Your Dynatrace Bill: How to Cut Observability Costs, Not Visibility
    Architecting for Value: A Playbook for Sustainable Observability
    How to Cut Observability Costs with Synthetic Monitoring and Responsive Pipelines
    Unlock Deeper Insights: Introducing GitLab Event Integration with Mezmo
    Introducing the New Mezmo Product Homepage
    The Inconvenient Truth About AI Ethics in Observability
    Observability's Moneyball Moment: How AI Is Changing the Game (Not Ending It)
    Do you Grok It?
    Top Five Reasons Telemetry Pipelines Should Be on Every Engineer’s Radar
    Is It a Cup or a Pot? Helping You Pinpoint the Problem—and Sleep Through the Night
    Smarter Telemetry Pipelines: The Key to Cutting Datadog Costs and Observability Chaos
    Why Datadog Falls Short for Log Management and What to Do Instead
    Telemetry for Modern Apps: Reducing MTTR with Smarter Signals
    Transforming Observability: Simpler, Smarter, and More Affordable Data Control
    Datadog: The Good, The Bad, The Costly
    Mezmo Recognized with 25 G2 Awards for Spring 2025
    Reducing Telemetry Toil with Rapid Pipelining
    Cut Costs, Not Insights:   A Practical Guide to Telemetry Data Optimization
    Webinar Recap: Telemetry Pipeline 101
    Petabyte Scale, Gigabyte Costs: Mezmo’s Evolution from ElasticSearch to Quickwit
    2024 Recap - Highlights of Mezmo’s product enhancements
    My Favorite Observability and DevOps Articles of 2024
    AWS re:Invent ‘24: Generative AI Observability, Platform Engineering, and 99.9995% Availability
    From Gartner IOCS 2024 Conference: AI, Observability Data, and Telemetry Pipelines
    Our team’s learnings from Kubecon: Use Exemplars, Configuring OTel, and OTTL cookbook
    How Mezmo Uses a Telemetry Pipeline to Handle Metrics, Part II
    Webinar Recap: 2024 DORA Report: Accelerate State of DevOps
    Kubecon ‘24 recap: Patent Trolls, OTel Lessons at Scale, and Principle Platform Abstractions
    Announcing Mezmo Flow: Build a Telemetry Pipeline in 15 minutes
    Key Takeaways from the 2024 DORA Report
    Webinar Recap | Telemetry Data Management: Tales from the Trenches
    What are SLOs/SLIs/SLAs?
    Webinar Recap | Next Gen Log Management: Maximize Log Value with Telemetry Pipelines
    Creating In-Stream Alerts for Telemetry Data
    Creating Re-Usable Components for Telemetry Pipelines
    Optimizing Data for Service Management Objective Monitoring
    More Value From Your Logs: Next Generation Log Management from Mezmo
    A Day in the Life of a Mezmo SRE
    Webinar Recap: Applying a Data Engineering Approach to Telemetry Data
    Dogfooding at Mezmo: How we used telemetry pipeline to reduce data volume
    Unlocking Business Insights with Telemetry Pipelines
    Why Your Telemetry (Observability) Pipelines Need to be Responsive
    How Data Profiling Can Reduce Burnout
    Data Optimization Technique: Route Data to Specialized Processing Chains
    Data Privacy Takeaways from Gartner Security & Risk Summit
    Mastering Telemetry Pipelines: Driving Compliance and Data Optimization
    A Recap of Gartner Security and Risk Summit: GenAI, Augmented Cybersecurity, Burnout
    Why Telemetry Pipelines Should Be A Part Of Your Compliance Strategy
    Pipeline Module: Event to Metric
    Telemetry Data Compliance Module
    OpenTelemetry: The Key To Unified Telemetry Data
    Data optimization technique: convert events to metrics
    What’s New With Mezmo: In-stream Alerting
    How Mezmo Used Telemetry Pipeline to Handle Metrics
    Webinar Recap: Mastering Telemetry Pipelines - A DevOps Lifecycle Approach to Data Management
    Open-source Telemetry Pipelines: An Overview
    SRECon Recap: Product Reliability, Burn Out, and more
    Webinar Recap: How to Manage Telemetry Data with Confidence
    Webinar Recap: Myths and Realities in Telemetry Data Handling
    Using Vector to Build a Telemetry Pipeline Solution
    Managing Telemetry Data Overflow in Kubernetes with Resource Quotas and Limits
    How To Optimize Telemetry Pipelines For Better Observability and Security
    Gartner IOCS Conference Recap: Monitoring and Observing Environments with Telemetry Pipelines
    AWS re:Invent 2023 highlights: Observability at Stripe, Capital One, and McDonald’s
    Webinar Recap: Best Practices for Observability Pipelines
    Introducing Responsive Pipelines from Mezmo
    My First KubeCon - Tales of the K8’s community, DE&I, sustainability, and OTel
    Modernize Telemetry Pipeline Management with Mezmo Pipeline as Code
    How To Profile and Optimize Telemetry Data: A Deep Dive
    Kubernetes Telemetry Data Optimization in Five Steps with Mezmo
    Introducing Mezmo Edge: A Secure Approach To Telemetry Data
    Understand Kubernetes Telemetry Data Immediately With Mezmo’s Welcome Pipeline
    Unearthing Gold: Deriving Metrics from Logs with Mezmo Telemetry Pipeline
    Webinar Recap: The Single Pane of Glass Myth
    Empower Observability Engineers: Enhance Engineering With Mezmo
    Webinar Recap: How to Get More Out of Your Log Data
    Unraveling the Log Data Explosion: New Market Research Shows Trends and Challenges
    Webinar Recap: Unlocking the Full Value of Telemetry Data
    Data-Driven Decision Making: Leveraging Metrics and Logs-to-Metrics Processors
    How To Configure The Mezmo Telemetry Pipeline
    Supercharge Elasticsearch Observability With Telemetry Pipelines
    Enhancing Grafana Observability With Telemetry Pipelines
    Optimizing Your Splunk Experience with Telemetry Pipelines
    Webinar Recap: Unlocking Business Performance with Telemetry Data
    Enhancing Datadog Observability with Telemetry Pipelines
    Transforming Your Data With Telemetry Pipelines